

Blackrock Inc (BLK) - Technology Services Revenue (I:BIBLKTSR)
Level Chart
Basic Info
|
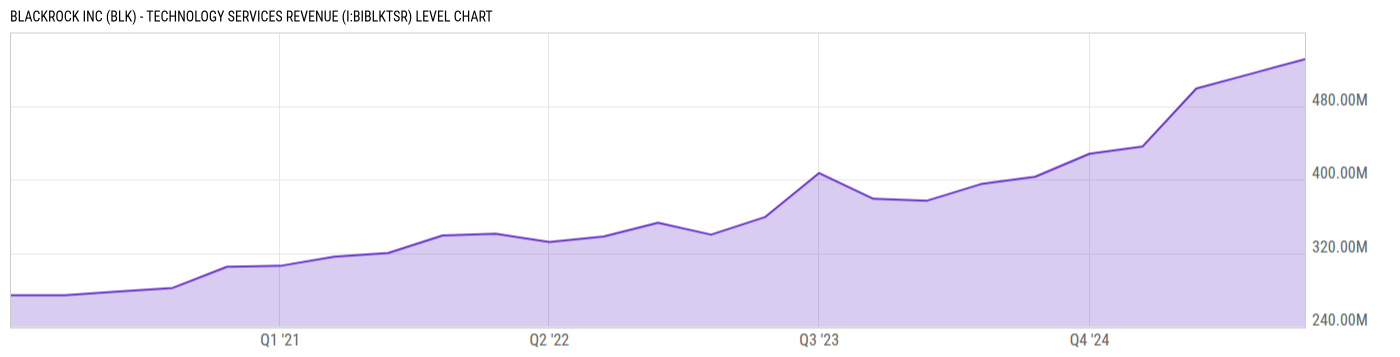
Blackrock Inc (BLK) - Technology Services Revenue is at a current level of 531.00M, up from 515.00M last quarter and up from 428.00M one year ago. This is a change of 3.11% from last quarter and 24.07% from one year ago. |
|
Blackrock Inc Technology Services Revenue refers to the income generated by BlackRock through various technology-related solutions and services it offers to clients within the financial industry, including institutional and retail clients. |
| Report | Fiscal.ai |
| Category | Segments & KPIs |
| Region | United States |
| Source | Fiscal.ai |
|
Data provided via Fiscal.ai |
Stats
| Last Value | 531.00M |
| Latest Period | Dec 2025 |
| Last Updated | Mar 23 2026, 14:08 EDT |
| Next Release | Apr 15 2026, 08:30 EDT (E) |
| Average Growth Rate | 11.59% |
| Value from Last Quarter | 515.00M |
| Change from Last Quarter | 3.11% |
| Value from 1 Year Ago | 428.00M |
| Change from 1 Year Ago | 24.07% |
| Frequency | Quarterly |
| Unit | USD |
| Adjustment | N/A |
| Download Source File |
Historical Data
| Date | Value |
|---|---|
| December 31, 2025 | 531.00M |
| September 30, 2025 | 515.00M |
| June 30, 2025 | 499.00M |
| March 31, 2025 | 436.00M |
| December 31, 2024 | 428.00M |
| September 30, 2024 | 403.00M |
| June 30, 2024 | 395.00M |
| March 31, 2024 | 377.00M |
| December 31, 2023 | 379.00M |
| September 30, 2023 | 407.00M |
| June 30, 2023 | 359.00M |
| March 31, 2023 | 340.00M |
| December 31, 2022 | 353.00M |
| Date | Value |
|---|---|
| September 30, 2022 | 338.00M |
| June 30, 2022 | 332.00M |
| March 31, 2022 | 341.00M |
| December 31, 2021 | 339.00M |
| September 30, 2021 | 320.00M |
| June 30, 2021 | 316.00M |
| March 31, 2021 | 306.00M |
| December 31, 2020 | 305.00M |
| September 30, 2020 | 282.00M |
| June 30, 2020 | 278.00M |
| March 31, 2020 | 274.00M |
| December 31, 2019 | 274.00M |
News
Basic Info
|
Blackrock Inc (BLK) - Technology Services Revenue is at a current level of 531.00M, up from 515.00M last quarter and up from 428.00M one year ago. This is a change of 3.11% from last quarter and 24.07% from one year ago. |
|
Blackrock Inc Technology Services Revenue refers to the income generated by BlackRock through various technology-related solutions and services it offers to clients within the financial industry, including institutional and retail clients. |
| Report | Fiscal.ai |
| Category | Segments & KPIs |
| Region | United States |
| Source | Fiscal.ai |
|
Data provided via Fiscal.ai |
Stats
| Last Value | 531.00M |
| Latest Period | Dec 2025 |
| Last Updated | Mar 23 2026, 14:08 EDT |
| Next Release | Apr 15 2026, 08:30 EDT (E) |
| Average Growth Rate | 11.59% |
| Value from Last Quarter | 515.00M |
| Change from Last Quarter | 3.11% |
| Value from 1 Year Ago | 428.00M |
| Change from 1 Year Ago | 24.07% |
| Frequency | Quarterly |
| Unit | USD |
| Adjustment | N/A |
| Download Source File |
Related Securities
Related Indicators
| Blackrock Inc (BLK) - Advisory & Other Revenue | 69.00M USD |
| Blackrock Inc (BLK) - Alternatives AUM | 429.07B USD |
| Blackrock Inc (BLK) - Cash Management AUM | 1.073T USD |
| Blackrock Inc (BLK) - Cash Management AUM Inflows | -6.177B USD |
| Blackrock Inc (BLK) - Cash Management Revenue | 340.00M USD |
| Blackrock Inc (BLK) - Distribution Fee Revenue | 389.00M USD |
| Blackrock Inc (BLK) - Equity AUM | 7.661T USD |
| Blackrock Inc (BLK) - ETFs AUM Inflows | 131.69B USD |
| Blackrock Inc (BLK) - ETFs Revenue | 2.406B USD |
| Blackrock Inc (BLK) - Fixed Income AUM | 3.271T USD |
| Blackrock Inc (BLK) - Institutional Inflows | -11.02B USD |
| Blackrock Inc (BLK) - Institutional Revenue | 1.429B USD |
| Blackrock Inc (BLK) - iShares / ETF AUM | 5.486T USD |
| Blackrock Inc (BLK) - Multi-Asset Class AUM | 1.223T USD |
| Blackrock Inc (BLK) - Performance Fee Revenue | 754.00M USD |
| Blackrock Inc (BLK) - Retail AUM Inflows | 15.23B USD |
| Blackrock Inc (BLK) - Retail Revenue | 1.263B USD |