

Blackrock Inc (BLK) - Performance Fee Revenue (I:BIBLKPFR)
Level Chart
Basic Info
|
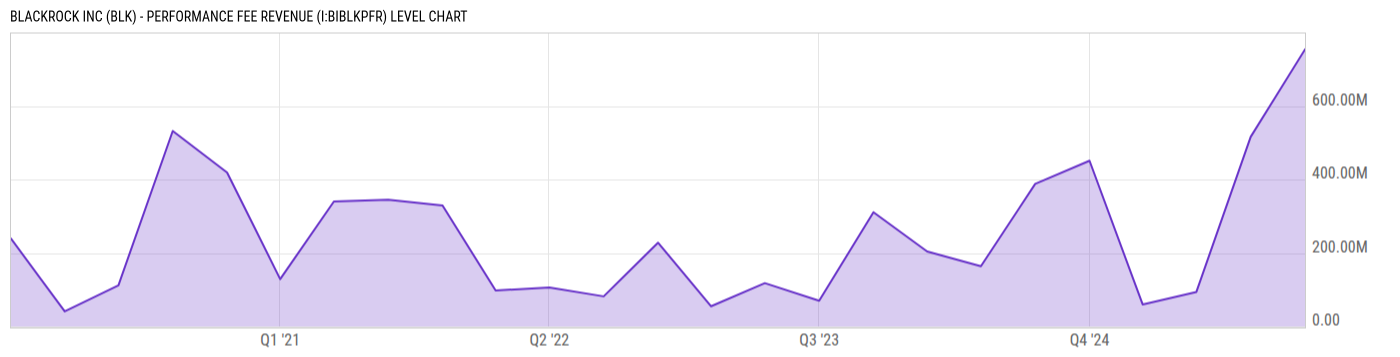
Blackrock Inc (BLK) - Performance Fee Revenue is at a current level of 754.00M, up from 516.00M last quarter and up from 451.00M one year ago. This is a change of 46.12% from last quarter and 67.18% from one year ago. |
|
Blackrock Inc Performance Fee Revenue refers to the income generated from performance fees associated with managing specific investment funds. |
| Report | Fiscal.ai |
| Category | Segments & KPIs |
| Region | United States |
| Source | Fiscal.ai |
|
Data provided via Fiscal.ai |
Stats
| Last Value | 754.00M |
| Latest Period | Dec 2025 |
| Last Updated | Mar 23 2026, 14:08 EDT |
| Next Release | Apr 15 2026, 08:30 EDT (E) |
| Average Growth Rate | 255.8% |
| Value from Last Quarter | 516.00M |
| Change from Last Quarter | 46.12% |
| Value from 1 Year Ago | 451.00M |
| Change from 1 Year Ago | 67.18% |
| Frequency | Quarterly |
| Unit | USD |
| Adjustment | N/A |
| Download Source File |
Historical Data
| Date | Value |
|---|---|
| December 31, 2025 | 754.00M |
| September 30, 2025 | 516.00M |
| June 30, 2025 | 94.00M |
| March 31, 2025 | 60.00M |
| December 31, 2024 | 451.00M |
| September 30, 2024 | 388.00M |
| June 30, 2024 | 164.00M |
| March 31, 2024 | 204.00M |
| December 31, 2023 | 311.00M |
| September 30, 2023 | 70.00M |
| June 30, 2023 | 118.00M |
| March 31, 2023 | 55.00M |
| December 31, 2022 | 228.00M |
| Date | Value |
|---|---|
| September 30, 2022 | 82.00M |
| June 30, 2022 | 106.00M |
| March 31, 2022 | 98.00M |
| December 31, 2021 | 329.00M |
| September 30, 2021 | 345.00M |
| June 30, 2021 | 340.00M |
| March 31, 2021 | 129.00M |
| December 31, 2020 | 419.00M |
| September 30, 2020 | 532.00M |
| June 30, 2020 | 112.00M |
| March 31, 2020 | 41.00M |
| December 31, 2019 | 239.00M |
News
Basic Info
|
Blackrock Inc (BLK) - Performance Fee Revenue is at a current level of 754.00M, up from 516.00M last quarter and up from 451.00M one year ago. This is a change of 46.12% from last quarter and 67.18% from one year ago. |
|
Blackrock Inc Performance Fee Revenue refers to the income generated from performance fees associated with managing specific investment funds. |
| Report | Fiscal.ai |
| Category | Segments & KPIs |
| Region | United States |
| Source | Fiscal.ai |
|
Data provided via Fiscal.ai |
Stats
| Last Value | 754.00M |
| Latest Period | Dec 2025 |
| Last Updated | Mar 23 2026, 14:08 EDT |
| Next Release | Apr 15 2026, 08:30 EDT (E) |
| Average Growth Rate | 255.8% |
| Value from Last Quarter | 516.00M |
| Change from Last Quarter | 46.12% |
| Value from 1 Year Ago | 451.00M |
| Change from 1 Year Ago | 67.18% |
| Frequency | Quarterly |
| Unit | USD |
| Adjustment | N/A |
| Download Source File |
Related Securities
Related Indicators
| Blackrock Inc (BLK) - Advisory & Other Revenue | 69.00M USD |
| Blackrock Inc (BLK) - Alternatives AUM | 429.07B USD |
| Blackrock Inc (BLK) - Cash Management AUM | 1.073T USD |
| Blackrock Inc (BLK) - Cash Management AUM Inflows | -6.177B USD |
| Blackrock Inc (BLK) - Cash Management Revenue | 340.00M USD |
| Blackrock Inc (BLK) - Distribution Fee Revenue | 389.00M USD |
| Blackrock Inc (BLK) - Equity AUM | 7.661T USD |
| Blackrock Inc (BLK) - ETFs AUM Inflows | 131.69B USD |
| Blackrock Inc (BLK) - ETFs Revenue | 2.406B USD |
| Blackrock Inc (BLK) - Fixed Income AUM | 3.271T USD |
| Blackrock Inc (BLK) - Institutional Inflows | -11.02B USD |
| Blackrock Inc (BLK) - Institutional Revenue | 1.429B USD |
| Blackrock Inc (BLK) - iShares / ETF AUM | 5.486T USD |
| Blackrock Inc (BLK) - Multi-Asset Class AUM | 1.223T USD |
| Blackrock Inc (BLK) - Retail AUM Inflows | 15.23B USD |
| Blackrock Inc (BLK) - Retail Revenue | 1.263B USD |
| Blackrock Inc (BLK) - Technology Services Revenue | 531.00M USD |