

Binance Smart Chain Network Utilization (I:BSCNU)
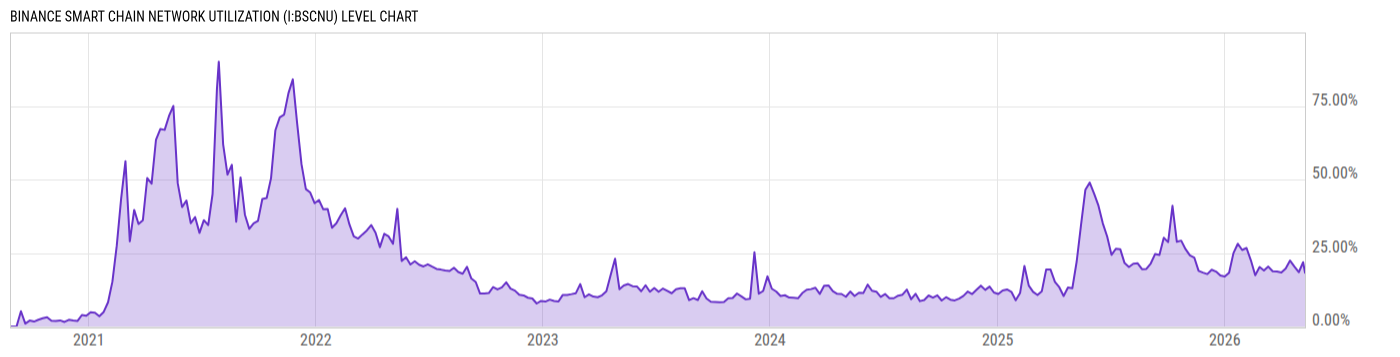
21.54% for May 30 2026
Level Chart
Basic Info
|
Binance Smart Chain Network Utilization is at 21.54%, compared to 21.23% yesterday and 48.92% last year. This is higher than the long term average of 20.79%. |
| Report | Binance Smart Chain Statistics |
| Category | Cryptocurrency |
| Region | N/A |
| Source | BscScan |
Stats
| Last Value | 21.54% |
| Latest Period | May 30 2026 |
| Last Updated | May 30 2026, 23:04 EDT |
| Next Release | May 31 2026, 23:00 EDT |
| Long Term Average | 20.79% |
| Average Growth Rate | 548.9% |
| Value from Yesterday | 21.23% |
| Change from Yesterday | 1.46% |
| Value from 1 Year Ago | 48.92% |
| Change from 1 Year Ago | -55.97% |
| Frequency | Daily |
| Unit | Percent |
| Adjustment | N/A |
| Download Source File | |
| Notes | Average gas used per block/ gas limit. |
Historical Data
| Date | Value |
|---|---|
| May 30, 2026 | 21.54% |
| May 29, 2026 | 21.23% |
| May 28, 2026 | 22.33% |
| May 27, 2026 | 21.55% |
| May 26, 2026 | 20.93% |
| May 25, 2026 | 21.46% |
| May 24, 2026 | 19.64% |
| May 23, 2026 | 20.36% |
| May 22, 2026 | 24.13% |
| May 21, 2026 | 21.43% |
| May 20, 2026 | 20.84% |
| May 19, 2026 | 20.38% |
| May 18, 2026 | 21.40% |
| May 17, 2026 | 18.78% |
| May 16, 2026 | 19.75% |
| May 15, 2026 | 21.44% |
| May 14, 2026 | 23.56% |
| May 13, 2026 | 22.50% |
| May 12, 2026 | 19.50% |
| May 11, 2026 | 20.41% |
| May 10, 2026 | 18.32% |
| May 09, 2026 | 19.82% |
| May 08, 2026 | 21.66% |
| May 07, 2026 | 21.85% |
| May 06, 2026 | 21.89% |
| Date | Value |
|---|---|
| May 05, 2026 | 20.78% |
| May 04, 2026 | 24.11% |
| May 03, 2026 | 19.78% |
| May 02, 2026 | 19.36% |
| May 01, 2026 | 19.40% |
| April 30, 2026 | 18.46% |
| April 29, 2026 | 19.36% |
| April 28, 2026 | 18.69% |
| April 27, 2026 | 19.05% |
| April 26, 2026 | 18.36% |
| April 25, 2026 | 19.33% |
| April 24, 2026 | 21.45% |
| April 23, 2026 | 20.38% |
| April 22, 2026 | 22.34% |
| April 21, 2026 | 23.24% |
| April 20, 2026 | 20.81% |
| April 19, 2026 | 21.43% |
| April 18, 2026 | 21.79% |
| April 17, 2026 | 22.32% |
| April 16, 2026 | 22.43% |
| April 15, 2026 | 22.61% |
| April 14, 2026 | 24.32% |
| April 13, 2026 | 23.33% |
| April 12, 2026 | 19.42% |
| April 11, 2026 | 18.53% |
News
Headline
Time (ET)
05/29 16:13
05/20 15:56
05/14 15:56
05/05 16:00
Basic Info
|
Binance Smart Chain Network Utilization is at 21.54%, compared to 21.23% yesterday and 48.92% last year. This is higher than the long term average of 20.79%. |
| Report | Binance Smart Chain Statistics |
| Category | Cryptocurrency |
| Region | N/A |
| Source | BscScan |
Stats
| Last Value | 21.54% |
| Latest Period | May 30 2026 |
| Last Updated | May 30 2026, 23:04 EDT |
| Next Release | May 31 2026, 23:00 EDT |
| Long Term Average | 20.79% |
| Average Growth Rate | 548.9% |
| Value from Yesterday | 21.23% |
| Change from Yesterday | 1.46% |
| Value from 1 Year Ago | 48.92% |
| Change from 1 Year Ago | -55.97% |
| Frequency | Daily |
| Unit | Percent |
| Adjustment | N/A |
| Download Source File | |
| Notes | Average gas used per block/ gas limit. |