

Austin-Round Rock, TX Business-Cycle Index (I:ARRTXBCI)
1306.36 for Mar 2026
Level Chart
Basic Info
|
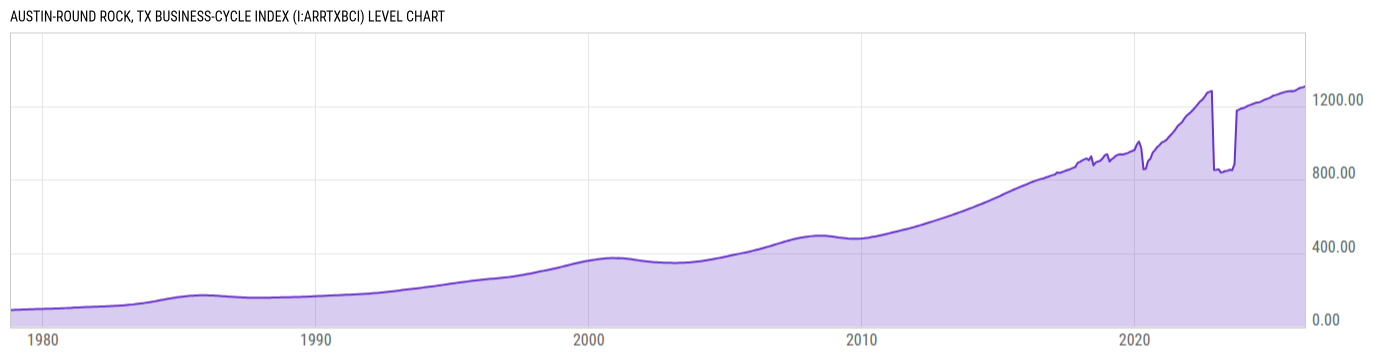
Austin-Round Rock, TX Business-Cycle Index is at a current level of 1306.36, up from 1301.20 last month and up from 1263.47 one year ago. This is a change of 0.40% from last month and 3.39% from one year ago. |
| Report | Texas Business-Cycle Indexes |
| Category | Economic Sentiment, Outlook and Activity |
| Region | Texas |
| Source | Federal Reserve Bank of Dallas |
Stats
| Last Value | 1306.36 |
| Latest Period | Mar 2026 |
| Last Updated | May 22 2026, 10:05 EDT |
| Next Release | Jun 19 2026, 10:00 EDT (E) |
| Average Growth Rate | 5.96% |
| Value from Last Month | 1301.20 |
| Change from Last Month | 0.40% |
| Value from 1 Year Ago | 1263.47 |
| Change from 1 Year Ago | 3.39% |
| Frequency | Monthly |
| Unit | Index October 1980=100 |
| Adjustment | N/A |
| Download Source File |
Historical Data
| Date | Value |
|---|---|
| March 31, 2026 | 1306.36 |
| February 28, 2026 | 1301.20 |
| January 31, 2026 | 1299.53 |
| December 31, 2025 | 1294.04 |
| November 30, 2025 | 1285.80 |
| October 31, 2025 | 1280.63 |
| September 30, 2025 | 1281.42 |
| August 31, 2025 | 1280.43 |
| July 31, 2025 | 1278.58 |
| June 30, 2025 | 1275.45 |
| May 31, 2025 | 1271.71 |
| April 30, 2025 | 1268.18 |
| March 31, 2025 | 1263.47 |
| February 28, 2025 | 1259.22 |
| January 31, 2025 | 1256.78 |
| December 31, 2024 | 1248.61 |
| November 30, 2024 | 1241.56 |
| October 31, 2024 | 1238.18 |
| September 30, 2024 | 1233.61 |
| August 31, 2024 | 1226.27 |
| July 31, 2024 | 1220.74 |
| June 30, 2024 | 1219.22 |
| May 31, 2024 | 1215.92 |
| April 30, 2024 | 1210.74 |
| March 31, 2024 | 1206.15 |
| Date | Value |
|---|---|
| February 29, 2024 | 1201.92 |
| January 31, 2024 | 1195.78 |
| December 31, 2023 | 1189.02 |
| November 30, 2023 | 1186.86 |
| October 31, 2023 | 1180.05 |
| September 30, 2023 | 1174.98 |
| August 31, 2023 | 884.74 |
| July 31, 2023 | 850.18 |
| June 30, 2023 | 852.90 |
| May 31, 2023 | 847.90 |
| April 30, 2023 | 846.38 |
| March 31, 2023 | 840.91 |
| February 28, 2023 | 838.08 |
| January 31, 2023 | 855.90 |
| December 31, 2022 | 853.53 |
| November 30, 2022 | 852.02 |
| October 31, 2022 | 1282.05 |
| September 30, 2022 | 1276.57 |
| August 31, 2022 | 1271.89 |
| July 31, 2022 | 1253.15 |
| June 30, 2022 | 1235.95 |
| May 31, 2022 | 1226.31 |
| April 30, 2022 | 1211.38 |
| March 31, 2022 | 1196.51 |
| February 28, 2022 | 1182.22 |
News
Headline
Time (ET)
05/13 15:57
05/01 16:52
04/30 13:32
04/30 09:10
04/23 08:36
Basic Info
|
Austin-Round Rock, TX Business-Cycle Index is at a current level of 1306.36, up from 1301.20 last month and up from 1263.47 one year ago. This is a change of 0.40% from last month and 3.39% from one year ago. |
| Report | Texas Business-Cycle Indexes |
| Category | Economic Sentiment, Outlook and Activity |
| Region | Texas |
| Source | Federal Reserve Bank of Dallas |
Stats
| Last Value | 1306.36 |
| Latest Period | Mar 2026 |
| Last Updated | May 22 2026, 10:05 EDT |
| Next Release | Jun 19 2026, 10:00 EDT (E) |
| Average Growth Rate | 5.96% |
| Value from Last Month | 1301.20 |
| Change from Last Month | 0.40% |
| Value from 1 Year Ago | 1263.47 |
| Change from 1 Year Ago | 3.39% |
| Frequency | Monthly |
| Unit | Index October 1980=100 |
| Adjustment | N/A |
| Download Source File |