

Atlanta-Sandy Springs-Roswell, GA Consumer Price Index (I:AGACPI)
325.96 for Apr 2026
Level Chart
Basic Info
|
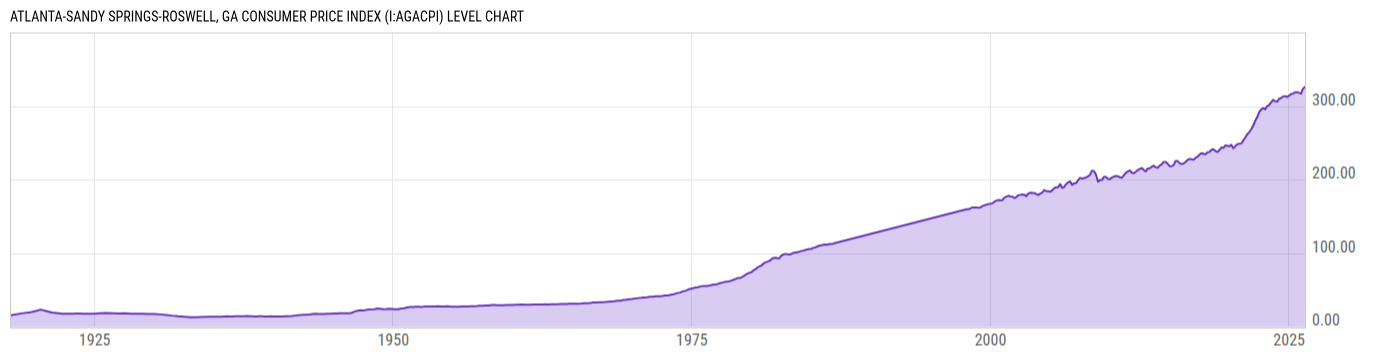
Atlanta-Sandy Springs-Roswell, GA Consumer Price Index is at a current level of 325.96, up from 323.54 two months ago and up from 316.81 one year ago. This is a change of 0.75% from two months ago and 2.89% from one year ago. |
| Report | Consumer Price Index |
| Category | Consumer Prices |
| Region | N/A |
| Source | Bureau of Labor Statistics |
Stats
| Last Value | 325.96 |
| Latest Period | Apr 2026 |
| Last Updated | May 15 2026, 18:17 EDT |
| Next Release | Jun 10 2026, 08:30 EDT |
| Average Growth Rate | 4.42% |
| Value from Two Months Ago | 323.54 |
| Change from Two Months Ago | 0.75% |
| Value from 1 Year Ago | 316.81 |
| Change from 1 Year Ago | 2.89% |
| Frequency | Bimonthly |
| Unit | Index 1982-84=100 |
| Adjustment | Not Seasonally Adjusted |
| Download Source File | |
| Notes | All items. |
Historical Data
| Date | Value |
|---|---|
| April 30, 2026 | 325.96 |
| February 28, 2026 | 323.54 |
| December 31, 2025 | 316.77 |
| August 31, 2025 | 318.88 |
| June 30, 2025 | 318.57 |
| April 30, 2025 | 316.81 |
| February 28, 2025 | 316.35 |
| December 31, 2024 | 314.09 |
| October 31, 2024 | 312.26 |
| August 31, 2024 | 313.44 |
| June 30, 2024 | 313.01 |
| April 30, 2024 | 310.84 |
| February 29, 2024 | 309.91 |
| December 31, 2023 | 305.98 |
| October 31, 2023 | 306.44 |
| August 31, 2023 | 308.34 |
| June 30, 2023 | 305.07 |
| April 30, 2023 | 301.45 |
| February 28, 2023 | 299.92 |
| December 31, 2022 | 295.45 |
| October 31, 2022 | 297.06 |
| August 31, 2022 | 295.47 |
| June 30, 2022 | 291.76 |
| April 30, 2022 | 284.92 |
| February 28, 2022 | 279.74 |
| Date | Value |
|---|---|
| December 31, 2021 | 273.42 |
| October 31, 2021 | 268.36 |
| August 31, 2021 | 264.50 |
| June 30, 2021 | 261.66 |
| April 30, 2021 | 257.07 |
| February 28, 2021 | 252.97 |
| December 31, 2020 | 249.05 |
| October 31, 2020 | 248.79 |
| August 31, 2020 | 248.07 |
| June 30, 2020 | 245.18 |
| April 30, 2020 | 242.62 |
| February 29, 2020 | 247.04 |
| December 31, 2019 | 245.08 |
| October 31, 2019 | 245.86 |
| August 31, 2019 | 246.31 |
| June 30, 2019 | 243.09 |
| April 30, 2019 | 243.38 |
| February 28, 2019 | 240.07 |
| December 31, 2018 | 237.28 |
| October 31, 2018 | 238.67 |
| August 31, 2018 | 241.03 |
| June 30, 2018 | 240.38 |
| April 30, 2018 | 237.42 |
| February 28, 2018 | 237.00 |
| December 31, 2017 | 234.11 |
News
Headline
Time (ET)
05/22 09:11
05/14 06:14
Basic Info
|
Atlanta-Sandy Springs-Roswell, GA Consumer Price Index is at a current level of 325.96, up from 323.54 two months ago and up from 316.81 one year ago. This is a change of 0.75% from two months ago and 2.89% from one year ago. |
| Report | Consumer Price Index |
| Category | Consumer Prices |
| Region | N/A |
| Source | Bureau of Labor Statistics |
Stats
| Last Value | 325.96 |
| Latest Period | Apr 2026 |
| Last Updated | May 15 2026, 18:17 EDT |
| Next Release | Jun 10 2026, 08:30 EDT |
| Average Growth Rate | 4.42% |
| Value from Two Months Ago | 323.54 |
| Change from Two Months Ago | 0.75% |
| Value from 1 Year Ago | 316.81 |
| Change from 1 Year Ago | 2.89% |
| Frequency | Bimonthly |
| Unit | Index 1982-84=100 |
| Adjustment | Not Seasonally Adjusted |
| Download Source File | |
| Notes | All items. |