

At&t Inc (T) - Fiber Broadband Net Additions (I:AITFBNA)
Level Chart
Basic Info
|
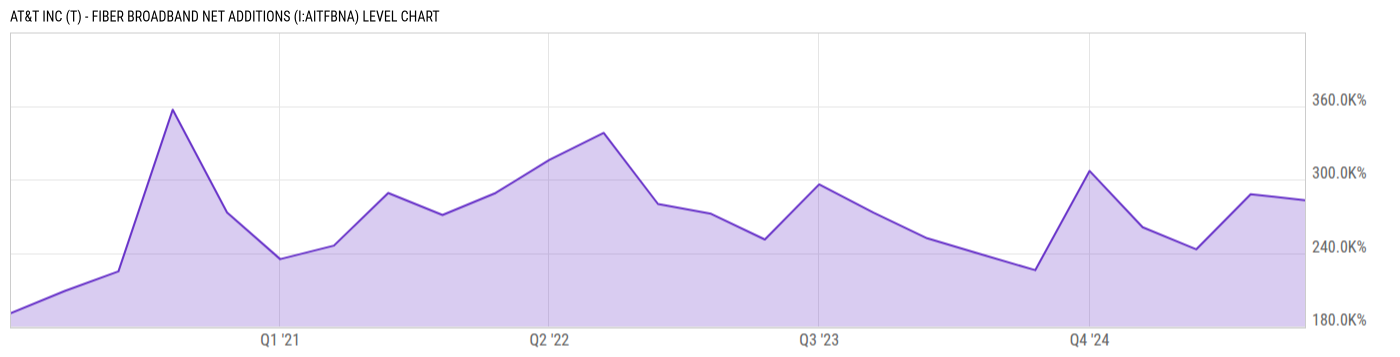
At&t Inc (T) - Fiber Broadband Net Additions is at 283.0K%, compared to 288.0K% last quarter and 307.0K% last year. This is higher than the long term average of 268.4K%. |
|
At&t Inc Fiber Broadband Net Additions metric reflects the growth in the count of customers or subscribers who have newly acquired fiber-optic broadband internet services or those who have discontinued their services within the defined period. |
| Report | Fiscal.ai |
| Category | Segments & KPIs |
| Region | United States |
| Source | Fiscal.ai |
|
Data provided via Fiscal.ai |
Stats
| Last Value | 283.0K% |
| Latest Period | Dec 2025 |
| Last Updated | Mar 23 2026, 14:08 EDT |
| Next Release | Jul 15 2026, 08:30 EDT (E) |
| Long Term Average | 268.4K% |
| Average Growth Rate | 12.01% |
| Value from Last Quarter | 288.0K% |
| Change from Last Quarter | -1.74% |
| Value from 1 Year Ago | 307.0K% |
| Change from 1 Year Ago | -7.82% |
| Frequency | Quarterly |
| Unit | Percent |
| Adjustment | N/A |
| Download Source File |
Historical Data
| Date | Value |
|---|---|
| December 31, 2025 | 283.0K% |
| September 30, 2025 | 288.0K% |
| June 30, 2025 | 243.0K% |
| March 31, 2025 | 261.0K% |
| December 31, 2024 | 307.0K% |
| September 30, 2024 | 226.0K% |
| June 30, 2024 | 239.0K% |
| March 31, 2024 | 252.0K% |
| December 31, 2023 | 273.0K% |
| September 30, 2023 | 296.0K% |
| June 30, 2023 | 251.0K% |
| March 31, 2023 | 272.0K% |
| December 31, 2022 | 280.0K% |
| Date | Value |
|---|---|
| September 30, 2022 | 338.0K% |
| June 30, 2022 | 316.0K% |
| March 31, 2022 | 289.0K% |
| December 31, 2021 | 271.0K% |
| September 30, 2021 | 289.0K% |
| June 30, 2021 | 246.0K% |
| March 31, 2021 | 235.0K% |
| December 31, 2020 | 273.0K% |
| September 30, 2020 | 357.0K% |
| June 30, 2020 | 225.0K% |
| March 31, 2020 | 209.0K% |
| December 31, 2019 | 191.0K% |
News
Basic Info
|
At&t Inc (T) - Fiber Broadband Net Additions is at 283.0K%, compared to 288.0K% last quarter and 307.0K% last year. This is higher than the long term average of 268.4K%. |
|
At&t Inc Fiber Broadband Net Additions metric reflects the growth in the count of customers or subscribers who have newly acquired fiber-optic broadband internet services or those who have discontinued their services within the defined period. |
| Report | Fiscal.ai |
| Category | Segments & KPIs |
| Region | United States |
| Source | Fiscal.ai |
|
Data provided via Fiscal.ai |
Stats
| Last Value | 283.0K% |
| Latest Period | Dec 2025 |
| Last Updated | Mar 23 2026, 14:08 EDT |
| Next Release | Jul 15 2026, 08:30 EDT (E) |
| Long Term Average | 268.4K% |
| Average Growth Rate | 12.01% |
| Value from Last Quarter | 288.0K% |
| Change from Last Quarter | -1.74% |
| Value from 1 Year Ago | 307.0K% |
| Change from 1 Year Ago | -7.82% |
| Frequency | Quarterly |
| Unit | Percent |
| Adjustment | N/A |
| Download Source File |
Related Securities
Related Indicators
| At&t Inc (T) - Communications Operating Contribution | 6.775B USD |
| At&t Inc (T) - Communications Revenue | 32.12B USD |
| At&t Inc (T) - Corporate & Other Revenue | 86.00M USD |