

At&t Inc (T) - Corporate & Other Revenue (I:AITCOR)
Level Chart
Basic Info
|
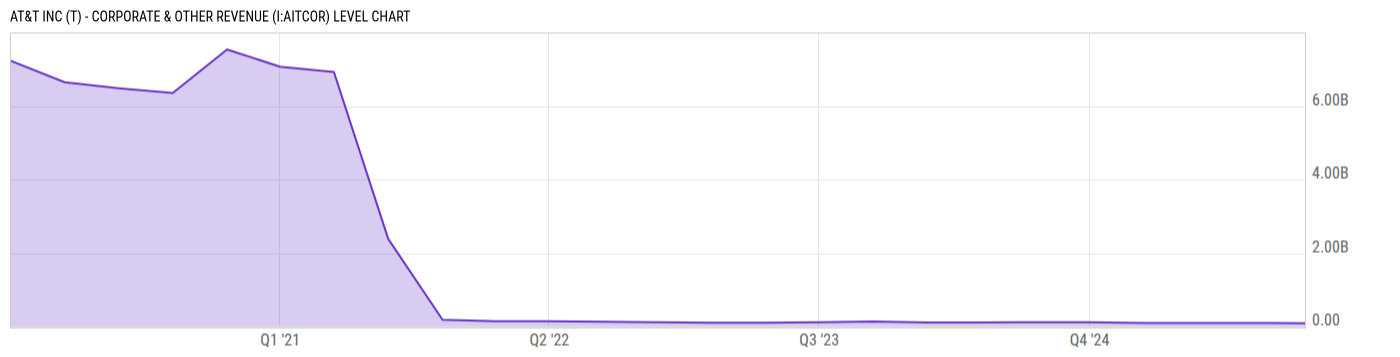
At&t Inc (T) - Corporate & Other Revenue is at a current level of 86.00M, down from 98.00M last quarter and down from 115.00M one year ago. This is a change of -12.24% from last quarter and -25.22% from one year ago. |
|
At&t Inc Corporate & Other Revenue includes various miscellaneous income and financial transactions that do not fall into the primary revenue categories associated with the company's core telecommunications and media operations. |
| Report | Fiscal.ai |
| Category | Segments & KPIs |
| Region | United States |
| Source | Fiscal.ai |
|
Data provided via Fiscal.ai |
Stats
| Last Value | 86.00M |
| Latest Period | Dec 2025 |
| Last Updated | Mar 23 2026, 14:08 EDT |
| Next Release | Jul 15 2026, 08:30 EDT (E) |
| Average Growth Rate | -37.57% |
| Value from Last Quarter | 98.00M |
| Change from Last Quarter | -12.24% |
| Value from 1 Year Ago | 115.00M |
| Change from 1 Year Ago | -25.22% |
| Frequency | Quarterly |
| Unit | USD |
| Adjustment | N/A |
| Download Source File |
Historical Data
| Date | Value |
|---|---|
| December 31, 2025 | 86.00M |
| September 30, 2025 | 98.00M |
| June 30, 2025 | 94.00M |
| March 31, 2025 | 95.00M |
| December 31, 2024 | 115.00M |
| September 30, 2024 | 117.00M |
| June 30, 2024 | 112.00M |
| March 31, 2024 | 108.00M |
| December 31, 2023 | 135.00M |
| September 30, 2023 | 114.00M |
| June 30, 2023 | 105.00M |
| March 31, 2023 | 104.00M |
| December 31, 2022 | 117.00M |
| Date | Value |
|---|---|
| September 30, 2022 | 127.00M |
| June 30, 2022 | 140.00M |
| March 31, 2022 | 146.00M |
| December 31, 2021 | 185.00M |
| September 30, 2021 | 2.384B |
| June 30, 2021 | 6.924B |
| March 31, 2021 | 7.068B |
| December 31, 2020 | 7.537B |
| September 30, 2020 | 6.354B |
| June 30, 2020 | 6.485B |
| March 31, 2020 | 6.645B |
| December 31, 2019 | 7.228B |
News
Basic Info
|
At&t Inc (T) - Corporate & Other Revenue is at a current level of 86.00M, down from 98.00M last quarter and down from 115.00M one year ago. This is a change of -12.24% from last quarter and -25.22% from one year ago. |
|
At&t Inc Corporate & Other Revenue includes various miscellaneous income and financial transactions that do not fall into the primary revenue categories associated with the company's core telecommunications and media operations. |
| Report | Fiscal.ai |
| Category | Segments & KPIs |
| Region | United States |
| Source | Fiscal.ai |
|
Data provided via Fiscal.ai |
Stats
| Last Value | 86.00M |
| Latest Period | Dec 2025 |
| Last Updated | Mar 23 2026, 14:08 EDT |
| Next Release | Jul 15 2026, 08:30 EDT (E) |
| Average Growth Rate | -37.57% |
| Value from Last Quarter | 98.00M |
| Change from Last Quarter | -12.24% |
| Value from 1 Year Ago | 115.00M |
| Change from 1 Year Ago | -25.22% |
| Frequency | Quarterly |
| Unit | USD |
| Adjustment | N/A |
| Download Source File |