

Aluminum Price (I:APNM)
3439.00 USD/mt for Jun 2026
Level Chart
Basic Info
|
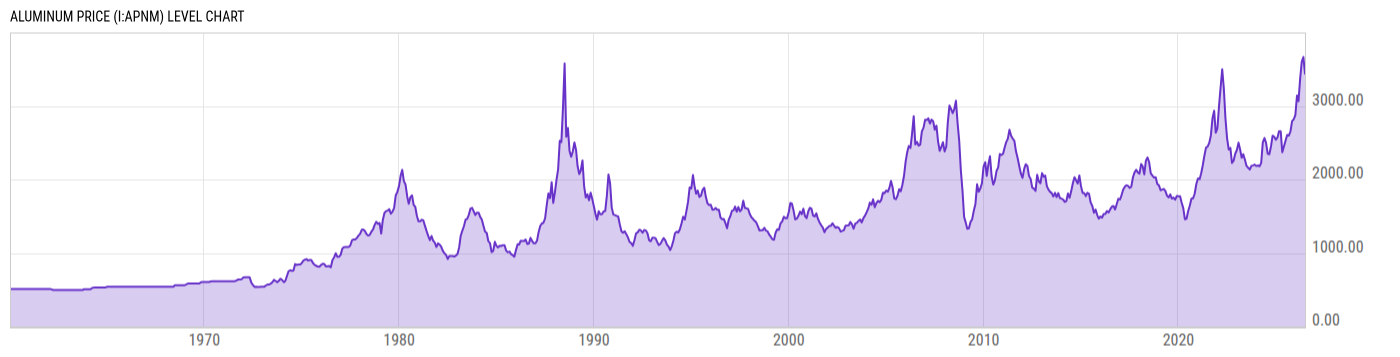
Aluminum Price is at a current level of 3439.00, down from 3666.00 last month and up from 2526.00 one year ago. This is a change of -6.19% from last month and 36.14% from one year ago. |
| Report | Commodity Markets Review |
| Categories | Agriculture and Livestock , Chemicals , Metals |
| Region | N/A |
| Source | World Bank |
Stats
| Last Value | 3439.00 |
| Latest Period | Jun 2026 |
| Last Updated | Jul 2 2026, 17:01 EDT |
| Next Release | Aug 4 2026, 11:00 EDT (E) |
| Average Growth Rate | 4.22% |
| Value from Last Month | 3666.00 |
| Change from Last Month | -6.19% |
| Value from 1 Year Ago | 2526.00 |
| Change from 1 Year Ago | 36.14% |
| Frequency | Monthly |
| Unit | USD per Metric Ton |
| Adjustment | N/A |
| Download Source File | |
| Notes | $/metric tonne |
Historical Data
| Date | Value |
|---|---|
| June 30, 2026 | 3439.00 |
| May 31, 2026 | 3666.00 |
| April 30, 2026 | 3600.00 |
| March 31, 2026 | 3373.00 |
| February 28, 2026 | 3065.00 |
| January 31, 2026 | 3142.00 |
| December 31, 2025 | 2876.00 |
| November 30, 2025 | 2819.00 |
| October 31, 2025 | 2793.00 |
| September 30, 2025 | 2653.00 |
| August 31, 2025 | 2597.00 |
| July 31, 2025 | 2606.00 |
| June 30, 2025 | 2526.00 |
| May 31, 2025 | 2449.00 |
| April 30, 2025 | 2372.00 |
| March 31, 2025 | 2658.00 |
| February 28, 2025 | 2658.00 |
| January 31, 2025 | 2573.00 |
| December 31, 2024 | 2541.00 |
| November 30, 2024 | 2582.00 |
| October 31, 2024 | 2596.00 |
| September 30, 2024 | 2450.00 |
| August 31, 2024 | 2344.00 |
| July 31, 2024 | 2349.00 |
| June 30, 2024 | 2498.00 |
| Date | Value |
|---|---|
| May 31, 2024 | 2564.54 |
| April 30, 2024 | 2506.10 |
| March 31, 2024 | 2226.16 |
| February 29, 2024 | 2179.46 |
| January 31, 2024 | 2192.82 |
| December 31, 2023 | 2182.43 |
| November 30, 2023 | 2202.26 |
| October 31, 2023 | 2192.21 |
| September 30, 2023 | 2184.67 |
| August 31, 2023 | 2136.57 |
| July 31, 2023 | 2159.73 |
| June 30, 2023 | 2184.75 |
| May 31, 2023 | 2268.60 |
| April 30, 2023 | 2343.23 |
| March 31, 2023 | 2296.42 |
| February 28, 2023 | 2416.18 |
| January 31, 2023 | 2501.82 |
| December 31, 2022 | 2401.69 |
| November 30, 2022 | 2350.72 |
| October 31, 2022 | 2255.54 |
| September 30, 2022 | 2224.76 |
| August 31, 2022 | 2430.79 |
| July 31, 2022 | 2408.42 |
| June 30, 2022 | 2563.44 |
| May 31, 2022 | 2830.32 |
News
Headline
Time (ET)
07/15 06:12
07/14 08:48
07/14 07:51
06/19 07:05
06/18 06:42
Basic Info
|
Aluminum Price is at a current level of 3439.00, down from 3666.00 last month and up from 2526.00 one year ago. This is a change of -6.19% from last month and 36.14% from one year ago. |
| Report | Commodity Markets Review |
| Categories | Agriculture and Livestock , Chemicals , Metals |
| Region | N/A |
| Source | World Bank |
Stats
| Last Value | 3439.00 |
| Latest Period | Jun 2026 |
| Last Updated | Jul 2 2026, 17:01 EDT |
| Next Release | Aug 4 2026, 11:00 EDT (E) |
| Average Growth Rate | 4.22% |
| Value from Last Month | 3666.00 |
| Change from Last Month | -6.19% |
| Value from 1 Year Ago | 2526.00 |
| Change from 1 Year Ago | 36.14% |
| Frequency | Monthly |
| Unit | USD per Metric Ton |
| Adjustment | N/A |
| Download Source File | |
| Notes | $/metric tonne |