

Alphabet Inc (GOOGL) - Cost-per-Click Change (DISCONTINUED) (I:AIGOOGNQ)
Level Chart
Basic Info
|
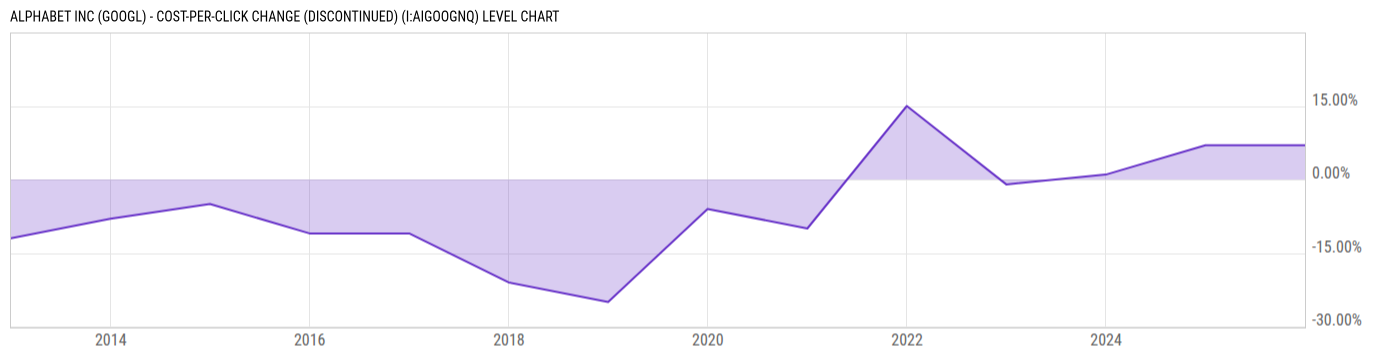
Alphabet Inc (GOOGL) - Cost-per-Click Change is at 7.00%, compared to 7.00% last month and 7.00% last year. This is higher than the long term average of -5.71%. |
|
Cost-per-Click Change data set offers a comprehensive analysis of the changes in cost-per-click (CPC) within Alphabet Inc. (GOOG), a leading multinational technology conglomerate. This data set specifically focuses on tracking and evaluating the fluctuations in the average amount advertisers pay per click on Alphabet's advertising platforms. |
| Report | Fiscal.ai |
| Category | Segments & KPIs |
| Region | United States |
| Source | Fiscal.ai |
|
Data provided via Fiscal.ai |
Stats
| Last Value | 7.00% |
| Latest Period | Dec 2025 |
| Last Updated | Mar 11 2026, 16:23 EDT |
| Long Term Average | -5.71% |
| Average Growth Rate | 178.3% |
| Value from Last Month | 7.00% |
| Change from Last Month | 0.00% |
| Value from 1 Year Ago | 7.00% |
| Change from 1 Year Ago | 0.00% |
| Frequency | Monthly |
| Unit | Percent |
| Adjustment | N/A |
| Download Source File |
Historical Data
| Date | Value |
|---|---|
| December 31, 2025 | 7.00% |
| December 31, 2024 | 7.00% |
| December 31, 2023 | 1.00% |
| December 31, 2022 | -1.00% |
| December 31, 2021 | 15.00% |
| December 31, 2020 | -10.00% |
| December 31, 2019 | -6.00% |
| Date | Value |
|---|---|
| December 31, 2018 | -25.00% |
| December 31, 2017 | -21.00% |
| December 31, 2016 | -11.00% |
| December 31, 2015 | -11.00% |
| December 31, 2014 | -5.00% |
| December 31, 2013 | -8.00% |
| December 31, 2012 | -12.00% |
News
Basic Info
|
Alphabet Inc (GOOGL) - Cost-per-Click Change is at 7.00%, compared to 7.00% last month and 7.00% last year. This is higher than the long term average of -5.71%. |
|
Cost-per-Click Change data set offers a comprehensive analysis of the changes in cost-per-click (CPC) within Alphabet Inc. (GOOG), a leading multinational technology conglomerate. This data set specifically focuses on tracking and evaluating the fluctuations in the average amount advertisers pay per click on Alphabet's advertising platforms. |
| Report | Fiscal.ai |
| Category | Segments & KPIs |
| Region | United States |
| Source | Fiscal.ai |
|
Data provided via Fiscal.ai |
Stats
| Last Value | 7.00% |
| Latest Period | Dec 2025 |
| Last Updated | Mar 11 2026, 16:23 EDT |
| Long Term Average | -5.71% |
| Average Growth Rate | 178.3% |
| Value from Last Month | 7.00% |
| Change from Last Month | 0.00% |
| Value from 1 Year Ago | 7.00% |
| Change from 1 Year Ago | 0.00% |
| Frequency | Monthly |
| Unit | Percent |
| Adjustment | N/A |
| Download Source File |