

Albuquerque, NM Labor Force (I:ANMLLM39)
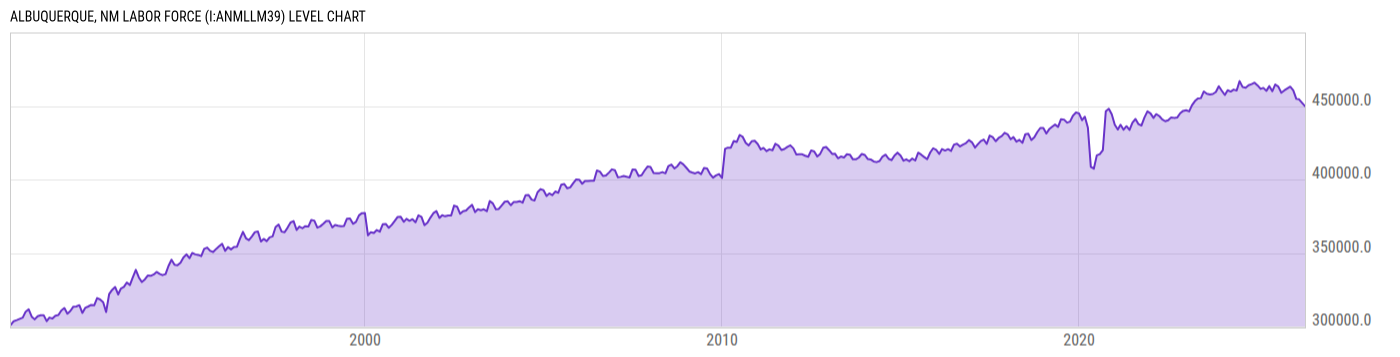
449855.0 for Apr 2026
Level Chart
Basic Info
|
Albuquerque, NM Labor Force is at a current level of 449855.0, down from 452125.0 last month and down from 463507.0 one year ago. This is a change of -0.50% from last month and -2.95% from one year ago. |
| Report | Metropolitan Area Employment and Unemployment |
| Categories | Employment , Hours and Wages |
| Region | N/A |
| Source | Bureau of Labor Statistics |
Stats
| Last Value | 449855.0 |
| Latest Period | Apr 2026 |
| Last Updated | Jun 3 2026, 12:18 EDT |
| Next Release | Jul 1 2026, 10:00 EDT |
| Average Growth Rate | 1.14% |
| Value from Last Month | 452125.0 |
| Change from Last Month | -0.50% |
| Value from 1 Year Ago | 463507.0 |
| Change from 1 Year Ago | -2.95% |
| Frequency | Monthly |
| Adjustment | Not Seasonally Adjusted |
| Download Source File | |
| Notes | Metropolitan Statistical Area. |
Historical Data
| Date | Value |
|---|---|
| April 30, 2026 | 449855.0 |
| March 31, 2026 | 452125.0 |
| February 28, 2026 | 454538.0 |
| January 31, 2026 | 454855.0 |
| December 31, 2025 | 460661.0 |
| November 30, 2025 | 463143.0 |
| October 31, 2025 | |
| September 30, 2025 | 460577.0 |
| August 31, 2025 | 459023.0 |
| July 31, 2025 | 463210.0 |
| June 30, 2025 | 464653.0 |
| May 31, 2025 | 460079.0 |
| April 30, 2025 | 463507.0 |
| March 31, 2025 | 460275.0 |
| February 28, 2025 | 462318.0 |
| January 31, 2025 | 461634.0 |
| December 31, 2024 | 463991.0 |
| November 30, 2024 | 465887.0 |
| October 31, 2024 | 464879.0 |
| September 30, 2024 | 464114.0 |
| August 31, 2024 | 462471.0 |
| July 31, 2024 | 462858.0 |
| June 30, 2024 | 466934.0 |
| May 31, 2024 | 460500.0 |
| April 30, 2024 | 461162.0 |
| Date | Value |
|---|---|
| March 31, 2024 | 459820.0 |
| February 29, 2024 | 460689.0 |
| January 31, 2024 | 457472.0 |
| December 31, 2023 | 460365.0 |
| November 30, 2023 | 463427.0 |
| October 31, 2023 | 459521.0 |
| September 30, 2023 | 458185.0 |
| August 31, 2023 | 457861.0 |
| July 31, 2023 | 458299.0 |
| June 30, 2023 | 459895.0 |
| May 31, 2023 | 455361.0 |
| April 30, 2023 | 455109.0 |
| March 31, 2023 | 453347.0 |
| February 28, 2023 | 450384.0 |
| January 31, 2023 | 446300.0 |
| December 31, 2022 | 447110.0 |
| November 30, 2022 | 446668.0 |
| October 31, 2022 | 445101.0 |
| September 30, 2022 | 442100.0 |
| August 31, 2022 | 441916.0 |
| July 31, 2022 | 442251.0 |
| June 30, 2022 | 440308.0 |
| May 31, 2022 | 439622.0 |
| April 30, 2022 | 440900.0 |
| March 31, 2022 | 443187.0 |
News
Headline
Time (ET)
05/29 08:15
Basic Info
|
Albuquerque, NM Labor Force is at a current level of 449855.0, down from 452125.0 last month and down from 463507.0 one year ago. This is a change of -0.50% from last month and -2.95% from one year ago. |
| Report | Metropolitan Area Employment and Unemployment |
| Categories | Employment , Hours and Wages |
| Region | N/A |
| Source | Bureau of Labor Statistics |
Stats
| Last Value | 449855.0 |
| Latest Period | Apr 2026 |
| Last Updated | Jun 3 2026, 12:18 EDT |
| Next Release | Jul 1 2026, 10:00 EDT |
| Average Growth Rate | 1.14% |
| Value from Last Month | 452125.0 |
| Change from Last Month | -0.50% |
| Value from 1 Year Ago | 463507.0 |
| Change from 1 Year Ago | -2.95% |
| Frequency | Monthly |
| Adjustment | Not Seasonally Adjusted |
| Download Source File | |
| Notes | Metropolitan Statistical Area. |