

Alachua County, FL Labor Force (I:ACFLLF)
142031.0 for May 2026
Level Chart
Basic Info
|
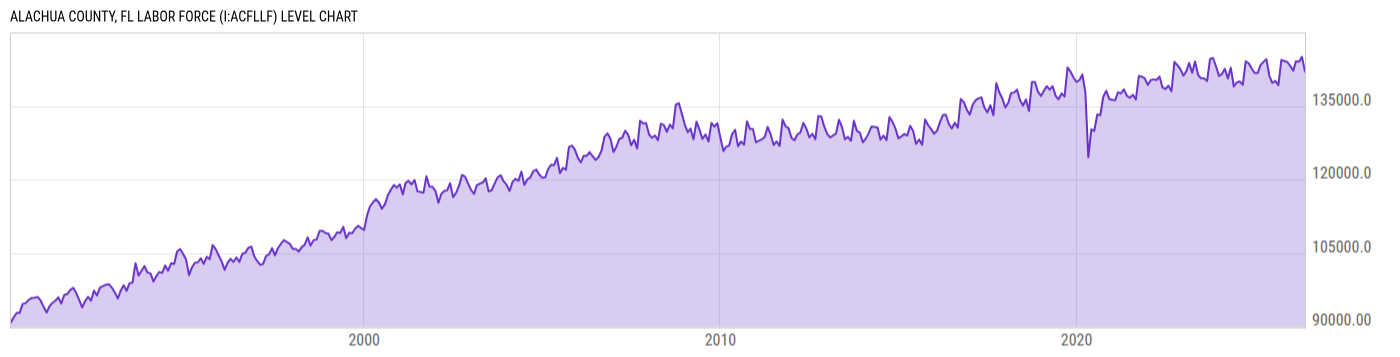
Alachua County, FL Labor Force is at a current level of 142031.0, down from 145034.0 last month and up from 141117.0 one year ago. This is a change of -2.07% from last month and 0.65% from one year ago. |
| Report | Metropolitan Area Employment and Unemployment |
| Categories | Employment , Hours and Wages |
| Region | N/A |
| Source | Bureau of Labor Statistics |
Stats
| Last Value | 142031.0 |
| Latest Period | May 2026 |
| Last Updated | Jul 1 2026, 10:56 EDT |
| Next Release | Jul 29 2026, 10:00 EDT |
| Average Growth Rate | 1.37% |
| Value from Last Month | 145034.0 |
| Change from Last Month | -2.07% |
| Value from 1 Year Ago | 141117.0 |
| Change from 1 Year Ago | 0.65% |
| Frequency | Monthly |
| Adjustment | Not Seasonally Adjusted |
| Download Source File |
Historical Data
| Date | Value |
|---|---|
| May 31, 2026 | 142031.0 |
| April 30, 2026 | 145034.0 |
| March 31, 2026 | 144045.0 |
| February 28, 2026 | 144156.0 |
| January 31, 2026 | 142218.0 |
| December 31, 2025 | 143170.0 |
| November 30, 2025 | 143982.0 |
| October 31, 2025 | |
| September 30, 2025 | 144373.0 |
| August 31, 2025 | 139227.0 |
| July 31, 2025 | 140116.0 |
| June 30, 2025 | 139720.0 |
| May 31, 2025 | 141117.0 |
| April 30, 2025 | 144563.0 |
| March 31, 2025 | 144004.0 |
| February 28, 2025 | 143301.0 |
| January 31, 2025 | 141714.0 |
| December 31, 2024 | 141724.0 |
| November 30, 2024 | 142655.0 |
| October 31, 2024 | 143727.0 |
| September 30, 2024 | 144106.0 |
| August 31, 2024 | 139329.0 |
| July 31, 2024 | 139993.0 |
| June 30, 2024 | 139791.0 |
| May 31, 2024 | 138975.0 |
| Date | Value |
|---|---|
| April 30, 2024 | 142815.0 |
| March 31, 2024 | 140630.0 |
| February 29, 2024 | 142598.0 |
| January 31, 2024 | 141522.0 |
| December 31, 2023 | 141142.0 |
| November 30, 2023 | 143114.0 |
| October 31, 2023 | 144801.0 |
| September 30, 2023 | 144580.0 |
| August 31, 2023 | 140087.0 |
| July 31, 2023 | 140638.0 |
| June 30, 2023 | 140649.0 |
| May 31, 2023 | 141330.0 |
| April 30, 2023 | 144067.0 |
| March 31, 2023 | 141807.0 |
| February 28, 2023 | 143775.0 |
| January 31, 2023 | 142108.0 |
| December 31, 2022 | 141187.0 |
| November 30, 2022 | 142533.0 |
| October 31, 2022 | 143340.0 |
| September 30, 2022 | 144005.0 |
| August 31, 2022 | 138013.0 |
| July 31, 2022 | 139139.0 |
| June 30, 2022 | 138480.0 |
| May 31, 2022 | 138778.0 |
| April 30, 2022 | 141004.0 |
News
Headline
Time (ET)
07/13 09:06
07/10 08:58
Basic Info
|
Alachua County, FL Labor Force is at a current level of 142031.0, down from 145034.0 last month and up from 141117.0 one year ago. This is a change of -2.07% from last month and 0.65% from one year ago. |
| Report | Metropolitan Area Employment and Unemployment |
| Categories | Employment , Hours and Wages |
| Region | N/A |
| Source | Bureau of Labor Statistics |
Stats
| Last Value | 142031.0 |
| Latest Period | May 2026 |
| Last Updated | Jul 1 2026, 10:56 EDT |
| Next Release | Jul 29 2026, 10:00 EDT |
| Average Growth Rate | 1.37% |
| Value from Last Month | 145034.0 |
| Change from Last Month | -2.07% |
| Value from 1 Year Ago | 141117.0 |
| Change from 1 Year Ago | 0.65% |
| Frequency | Monthly |
| Adjustment | Not Seasonally Adjusted |
| Download Source File |