

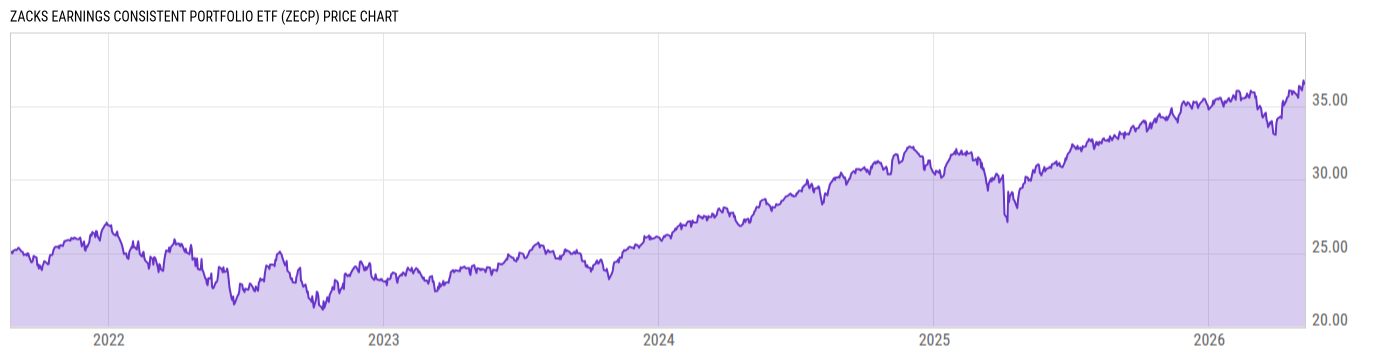
Zacks Earnings Consistent Portfolio ETF (ZECP)
36.49
-0.04
(-0.10%)
USD |
BATS |
May 08, 16:00
36.65
+0.16
(+0.43%)
After-Hours: 20:00
Price Chart
Key Stats
| Net Expense Ratio | Discount or Premium to NAV | Total Assets Under Management | 30-Day Average Daily Volume |
|---|---|---|---|
| 0.55% | -0.05% | 326.89M | 58208.17 |
| Weighted Average Dividend Yield | Turnover Ratio (Generic) | 1 Year Fund Level Flows | Max Drawdown (Since Inception) |
| 1.36% | 12.00% | 47.73M |
Basic Info
| Investment Strategy | |
| The Fund seeks to provide long-term total returns and minimize capital loss. The Fund pursues its investment objective by constructing a portfolio of companies that exhibit a track record of moving through recessionary periods with minimal impact on aggregate earnings growth relative to the overall equity market. |
| General | |
| Security Type | Exchange-Traded Fund |
| Equity Style | Large Cap Core |
| Broad Asset Class | US Equity |
| Broad Category | Equity |
| Global Peer Group | Equity US |
| Peer Group | Large-Cap Core Funds |
| Global Macro | Equity North America |
| US Macro | Large-Cap Funds |
| YCharts Categorization | -- |
| YCharts Benchmark | -- |
| Prospectus Objective | Growth & Income Funds |
| Fund Owner Firm Name | Zacks Investment Management |
| Broad Asset Class Benchmark Index | |
| ^SPXTR | 100.0% |
Performance Versus Peer Group
Annual Total Returns Versus Peers
As of May 09, 2026.
Asset Allocation
As of April 30, 2026.
| Type | % Net |
|---|---|
| Cash | 0.97% |
| Stock | 99.01% |
| Bond | 0.00% |
| Convertible | 0.00% |
| Preferred | 0.00% |
| Other | 0.02% |
Basic Info
| Investment Strategy | |
| The Fund seeks to provide long-term total returns and minimize capital loss. The Fund pursues its investment objective by constructing a portfolio of companies that exhibit a track record of moving through recessionary periods with minimal impact on aggregate earnings growth relative to the overall equity market. |
| General | |
| Security Type | Exchange-Traded Fund |
| Equity Style | Large Cap Core |
| Broad Asset Class | US Equity |
| Broad Category | Equity |
| Global Peer Group | Equity US |
| Peer Group | Large-Cap Core Funds |
| Global Macro | Equity North America |
| US Macro | Large-Cap Funds |
| YCharts Categorization | -- |
| YCharts Benchmark | -- |
| Prospectus Objective | Growth & Income Funds |
| Fund Owner Firm Name | Zacks Investment Management |
| Broad Asset Class Benchmark Index | |
| ^SPXTR | 100.0% |