

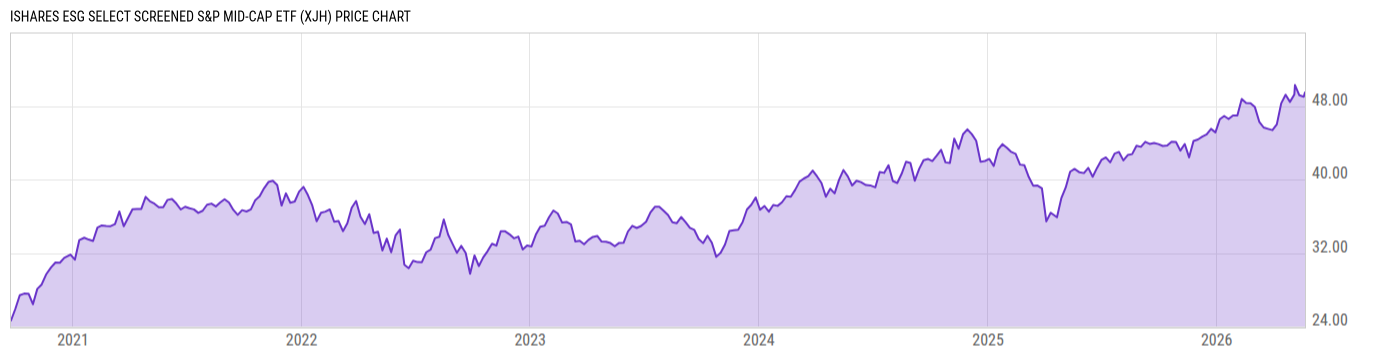
iShares ESG Select Screened S&P Mid-Cap ETF (XJH)
49.94
+0.10
(+0.20%)
USD |
BATS |
Jun 08, 16:00
Price Chart
Key Stats
| Net Expense Ratio | Discount or Premium to NAV | Total Assets Under Management | 30-Day Average Daily Volume |
|---|---|---|---|
| 0.12% | -0.11% | 397.44M | 27950.27 |
| Weighted Average Dividend Yield | Turnover Ratio (Generic) | 1 Year Fund Level Flows | Max Drawdown (Since Inception) |
| 1.19% | 21.00% | 45.46M |
Basic Info
| Investment Strategy | |
| The Fund seeks to track the investment results of the S&P MidCap 400 Sustainability Screened Index, which is composed of mid-capitalization US equities while applying screens for company involvement in controversies and controversial business activities as determined by S&P Dow Jones Indices LLC or SPDJI. |
| General | |
| Security Type | Exchange-Traded Fund |
| Equity Style | Small Cap Core |
| Broad Asset Class | US Equity |
| Broad Category | Equity |
| Global Peer Group | Equity US Sm&Mid Cap |
| Peer Group | Small-Cap Core Funds |
| Global Macro | Equity North America |
| US Macro | Small-Cap Funds |
| YCharts Categorization | -- |
| YCharts Benchmark | -- |
| Prospectus Objective | Mid-Cap Funds |
| Fund Owner Firm Name | BlackRock |
| Broad Asset Class Benchmark Index | |
| ^SPXTR | 100.0% |
Performance Versus Peer Group
Annual Total Returns Versus Peers
As of June 09, 2026.
Asset Allocation
As of May 31, 2026.
| Type | % Net |
|---|---|
| Cash | -2.62% |
| Stock | 99.64% |
| Bond | 0.07% |
| Convertible | 0.00% |
| Preferred | 0.00% |
| Other | 2.91% |
Basic Info
| Investment Strategy | |
| The Fund seeks to track the investment results of the S&P MidCap 400 Sustainability Screened Index, which is composed of mid-capitalization US equities while applying screens for company involvement in controversies and controversial business activities as determined by S&P Dow Jones Indices LLC or SPDJI. |
| General | |
| Security Type | Exchange-Traded Fund |
| Equity Style | Small Cap Core |
| Broad Asset Class | US Equity |
| Broad Category | Equity |
| Global Peer Group | Equity US Sm&Mid Cap |
| Peer Group | Small-Cap Core Funds |
| Global Macro | Equity North America |
| US Macro | Small-Cap Funds |
| YCharts Categorization | -- |
| YCharts Benchmark | -- |
| Prospectus Objective | Mid-Cap Funds |
| Fund Owner Firm Name | BlackRock |
| Broad Asset Class Benchmark Index | |
| ^SPXTR | 100.0% |