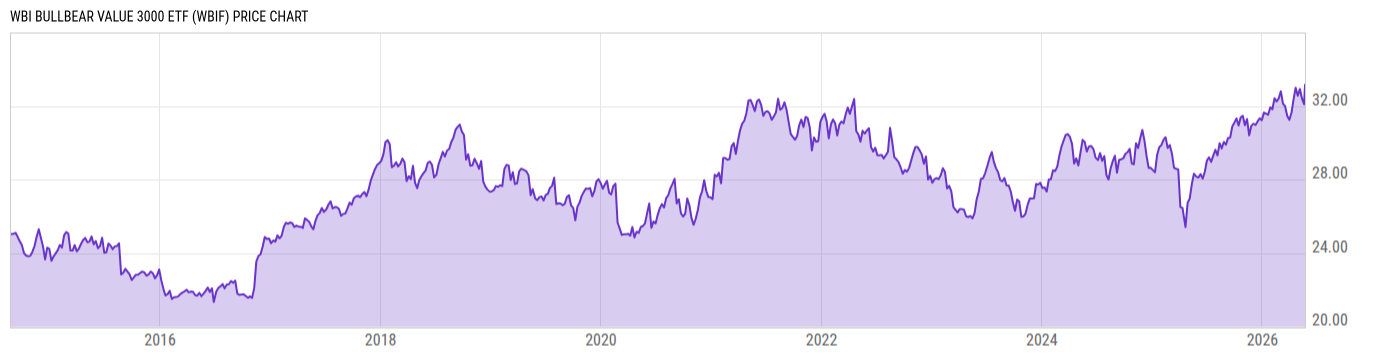
WBI BullBear Value 1000 ETF (WBIF)
27.31
+0.08 +0.31%
NYSE Arca
Dec 5, 20:00
Delayed 2m
USD
Key Stats
Expense Ratio | 1.18% |
Total Assets Under Management | 59.74M |
Share Class Assets Under Management | 59.74M |
30-Day Average Daily Volume | 7377.60 |
Net Asset Value | 27.30 |
Discount or Premium to NAV | 0.09% |
Turnover Ratio | 567.0% |
1 Year Fund Level Flows | 13.48M |
View All WBIF News
News
-
WireHeadlineTime (ET)
-
SA Breaking News12/14 09:28
-
Business Wire08/25 13:55
-
Business Wire06/12 15:46
Performance & Returns
Total Return (Price) | Total Return (NAV) | Cat. Total Return (NAV) | % Rank in Cat. (NAV) | |
---|---|---|---|---|
1M | -0.02% | 0.03% | 0.49% | 84 |
3M | 0.74% | 0.62% | 6.80% | 99 |
6M | 1.88% | 1.94% | 9.40% | 100 |
YTD | 0.56% | 0.58% | 20.80% | 100 |
1Y | -3.04% | -2.84% | 11.86% | 100 |
3Y | 5.15% | 5.14% | 9.44% | 97 |
5Y | 2.79% | 2.80% | 7.19% | 98 |
10Y | -- | -- | 10.64% | -- |
15Y | -- | -- | 7.17% | -- |
20Y | -- | -- | 6.71% | -- |
Asset Allocation
Type | % Net | % Long | % Short |
---|---|---|---|
Cash | 3.04% | 3.04% | 0.00% |
Stock | 96.96% | 96.96% | 0.00% |
Bond | 0.00% | 0.00% | 0.00% |
Convertible | 0.00% | 0.00% | 0.00% |
Preferred | 0.00% | 0.00% | 0.00% |
Other | 0.00% | 0.00% | 0.00% |
Region Exposure
Americas | 92.53% |
North America | 92.53% |
Latin America | 0.00% |
Greater Europe | 0.00% |
United Kingdom | 0.00% |
Europe Developed | 0.00% |
Europe Emerging | 0.00% |
Africa/Middle East | 0.00% |
Greater Asia | 7.47% |
Japan | 0.00% |
Australasia | 0.00% |
Asia Developed | 0.00% |
Asia Emerging | 7.47% |
Market Classification | |
% Developed Markets | 92.53% |
% Emerging Markets | 7.47% |
Stock Sector Exposure
Basic Materials | 2.02% |
Communication Services | 7.57% |
Consumer Cyclical | 8.14% |
Consumer Defensive | 6.74% |
Energy | 0.00% |
Financial Services | 22.63% |
Healthcare | 17.93% |
Industrials | 13.44% |
Real Estate | 0.00% |
Technology | 21.53% |
Utilities | 0.00% |
Stock Market Capitalization
Giant | 31.51% |
Large | 37.97% |
Medium | 23.96% |
Small | 6.55% |
Micro | 0.00% |
Stock Style Exposure
Large Cap Value | 18.71% |
Large Cap Blend | 39.82% |
Large Cap Growth | 10.95% |
Mid Cap Value | 13.10% |
Mid Cap Blend | 6.64% |
Mid Cap Growth | 4.22% |
Small Cap Value | 0.53% |
Small Cap Blend | 5.79% |
Small Cap Growth | 0.23% |
View More Holdings
As of Dec. 4, 2019
Top 10 Holdings
Symbol | Name | % Weight | Price | % Chg |
---|---|---|---|---|
NXPI | NXP Semiconductors NV | 4.89% | 119.66 | +2.18% |
HUM | Humana Inc | 4.63% | 349.81 | +1.33% |
GWW | W.W. Grainger Inc | 4.48% | 320.45 | +0.68% |
CMI | Cummins Inc | 4.16% | 181.48 | +1.54% |
CDW | CDW Corp | 4.09% | 136.72 | +1.71% |
VZ | Verizon Communications Inc | 4.06% | 61.10 | +0.46% |
UNH | UnitedHealth Group Inc | 4.04% | 280.91 | -0.39% |
GL | Globe Life Inc | 3.91% | 103.22 | +1.11% |
PNC | PNC Financial Services Group Inc | 3.65% | 154.11 | +1.25% |
CSGS | CSG Systems International Inc | 3.61% | 57.44 | +0.65% |
Advertisement
Basic Info
Investment Strategy | |
---|---|
The investment seeks long-term capital appreciation and the potential for current income, while also seeking to protect principal during unfavorable market conditions. The fund will seek to invest in the equity securities of small-capitalization, mid-capitalization, and large capitalization domestic and foreign companies that the sub-advisor to the fund and an affiliate of the advisor, believes display attractive prospects for growth in a company's intrinsic value, and in other tactical investment opportunities. It may invest up to 50% of its net assets in the securities of issuers in emerging markets. | |
General | |
Security Type | Exchange-Traded Fund |
Equity Style | Large Cap/Blend |
Fixed Income Style | -- |
Broad Asset Class | US Equity |
Broad Category | Equity |
Category Name | Large Value |
Prospectus Objective | Growth and Income |
Fund Owner Firm Name | WBI Investments |
Reports | |
One Page Report | Download |
Manager Info
Name | Tenure |
---|---|
Donald Schreiber | 5.19 yrs |
Steven Van Solkema | 0.67 yrs |
Net Fund Flows
1M | -2.747M |
3M | 6.946M |
6M | 5.583M |
YTD | 14.86M |
1Y | 13.48M |
3Y | -20.47M |
5Y | -50.68M |
10Y | -- |
Risk Info
Beta (5Y) | 0.6925 |
Max Drawdown (All) | 15.96% |
Historical Sharpe Ratio (10Y) | -- |
Historical Sortino (All) | 0.1615 |
30-Day Rolling Volatility | 7.21% |
Daily Value at Risk (VaR) 1% (All) | 1.92% |
Monthly Value at Risk (VaR) 1% (All) | 5.98% |
Fundamentals
Dividend Yield TTM (12-5-19) | 1.05% |
30-Day SEC Yield (10-31-19) | 1.00% |
7-Day SEC Yield | -- |
Weighted Average PE Ratio | 19.00 |
Weighted Average Price to Sales Ratio | 1.797 |
Weighted Average Price to Book Ratio | 3.436 |
Weighted Median ROE | 31.42% |
Weighted Median ROA | 8.83% |
Forecasted Dividend Yield | 2.00% |
Forecasted PE Ratio | 16.52 |
Forecasted Price to Sales Ratio | 1.825 |
Forecasted Price to Book Ratio | 3.458 |
Number of Holdings | 51 |
Growth Estimates
Forecasted 5 Yr Earnings Growth | 9.16% |
Forecasted Book Value Growth | 5.36% |
Forecasted Cash Flow Growth | 12.56% |
Forecasted Earnings Growth | 11.87% |
Forecasted Revenue Growth | 7.26% |
Attributes
Key Dates | |
---|---|
Inception Date | 8/25/2014 |
Termination Date | |
Last Annual Report Date | 6/30/2019 |
Last Prospectus Date | 10/25/2019 |
Attributes | |
Exchange Traded Share | Yes |
Exchange Traded Note | No |
Enhanced Index Fund | No |
Fixed Distribution Fund | No |
High-Net Worth Individual Fund | No |
Index Fund | No |
Inverse Fund | No |
Leveraged Fund | No |
Fund of Funds | No |
Currency Hedged Fund | No |
Synthetic Replication Fund | No |
Has Dividend Investment Plan | No |
Socially Responsible Fund | No |
General Availability | |
Available for Insurance Product | No |
Available for Retirement Plan | No |
Available for RRSP | No |
Advertisement