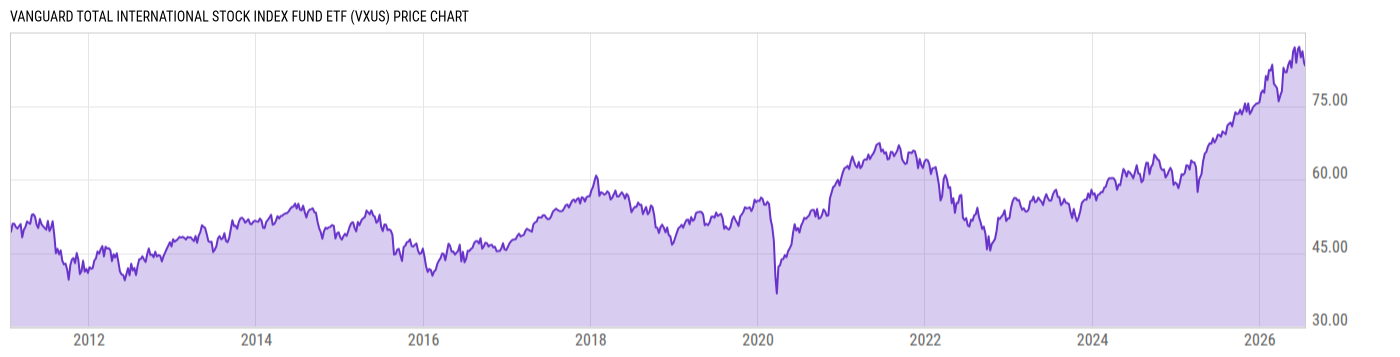
Vanguard Total International Stock ETF (VXUS)
54.20
-0.28 -0.51%
NASDAQ
Dec 9, 20:00
Delayed 2m
USD
Key Stats
Expense Ratio | 0.09% |
Total Assets Under Management | 403.14B |
Share Class Assets Under Management | 17.58B |
30-Day Average Daily Volume | 1.398M |
Net Asset Value | 54.19 |
Discount or Premium to NAV | 0.02% |
Turnover Ratio | 3.00% |
1 Year Fund Level Flows | 22.99B |
View All VXUS News
News
-
WireHeadlineTime (ET)
-
Yahoo10/07 10:45
-
SA Breaking News09/22 18:29
-
SA Breaking News02/27 08:46
-
SA Breaking News09/25 12:07
-
SA Breaking News07/23 11:34
-
SA Breaking News12/20 07:51
-
SA Breaking News02/29 14:54
-
PR Newswire02/26 10:00
-
SA Breaking News09/24 07:42
-
SA Breaking News06/25 09:41
Performance & Returns
Total Return (Price) | Total Return (NAV) | Cat. Total Return (NAV) | % Rank in Cat. (NAV) | |
---|---|---|---|---|
1M | -0.26% | 0.02% | 0.65% | 67 |
3M | 5.34% | 5.55% | 5.95% | 52 |
6M | 6.36% | 6.53% | 7.98% | 52 |
YTD | 17.17% | 17.25% | 18.21% | 61 |
1Y | 14.98% | 15.05% | 14.85% | 63 |
3Y | 8.10% | 8.25% | 8.57% | 46 |
5Y | 4.72% | 4.76% | 4.09% | 34 |
10Y | -- | -- | 4.76% | -- |
15Y | -- | -- | 4.75% | -- |
20Y | -- | -- | 3.71% | -- |
Asset Allocation
Type | % Net | % Long | % Short |
---|---|---|---|
Cash | 2.21% | 2.21% | 0.00% |
Stock | 97.69% | 97.69% | 0.00% |
Bond | 0.01% | 0.01% | 0.00% |
Convertible | 0.00% | 0.00% | 0.00% |
Preferred | 0.02% | 0.02% | 0.00% |
Other | 0.07% | 0.07% | 0.00% |
Region Exposure
Americas | 10.74% |
North America | 7.78% |
Latin America | 2.97% |
Greater Europe | 44.72% |
United Kingdom | 10.72% |
Europe Developed | 29.41% |
Europe Emerging | 1.81% |
Africa/Middle East | 2.77% |
Greater Asia | 44.54% |
Japan | 17.28% |
Australasia | 4.78% |
Asia Developed | 9.72% |
Asia Emerging | 12.76% |
Market Classification | |
% Developed Markets | 80.60% |
% Emerging Markets | 19.40% |
Stock Sector Exposure
Basic Materials | 7.56% |
Communication Services | 7.10% |
Consumer Cyclical | 10.79% |
Consumer Defensive | 9.22% |
Energy | 6.46% |
Financial Services | 20.07% |
Healthcare | 8.92% |
Industrials | 13.34% |
Real Estate | 4.04% |
Technology | 9.16% |
Utilities | 3.33% |
Stock Market Capitalization
Giant | 43.65% |
Large | 31.20% |
Medium | 19.21% |
Small | 5.25% |
Micro | 0.69% |
Stock Style Exposure
Large Cap Value | 25.92% |
Large Cap Blend | 25.16% |
Large Cap Growth | 23.69% |
Mid Cap Value | 7.09% |
Mid Cap Blend | 6.40% |
Mid Cap Growth | 5.85% |
Small Cap Value | 2.34% |
Small Cap Blend | 1.86% |
Small Cap Growth | 1.69% |
View More Holdings
As of Oct. 31, 2019
Top 10 Holdings
Symbol | Name | % Weight | Price | % Chg |
---|---|---|---|---|
NESN | Nestle SA | 1.24% | -- | -- |
BABA | Alibaba Group Holding Ltd ADR | 1.01% | 198.74 | -1.56% |
2330 | Taiwan Semiconductor Manufacturing Co Ltd | 0.94% | -- | -- |
00700 | Tencent Holdings Ltd | 0.93% | -- | -- |
ROG | Roche Holding AG Dividend Right Cert. | 0.83% | -- | -- |
005930 | Samsung Electronics Co Ltd | 0.81% | -- | -- |
NOVN | Novartis AG | 0.75% | -- | -- |
7203 | Toyota Motor Corp | 0.69% | -- | -- |
HSBA | HSBC Holdings PLC | 0.61% | -- | -- |
SAP | SAP SE | 0.51% | -- | -- |
Advertisement
Basic Info
Investment Strategy | |
---|---|
The investment seeks to track the performance of a benchmark index that measures the investment return of stocks issued by companies located in developed and emerging markets, excluding the United States. The fund employs an indexing investment approach designed to track the performance of the FTSE Global All Cap ex US Index, a float-adjusted market-capitalization-weighted index designed to measure equity market performance of companies located in developed and emerging markets, excluding the United States. It invests all, or substantially all, of its assets in the common stocks included in its target index. | |
General | |
Security Type | Exchange-Traded Fund |
Equity Style | Large Cap/Blend |
Fixed Income Style | -- |
Broad Asset Class | International Equity |
Broad Category | Equity |
Category Name | Foreign Large Blend |
Prospectus Objective | Foreign Stock |
Fund Owner Firm Name | Vanguard |
Benchmark Index | |
FTSE Global All Cap ex US (USA) NR USD | 100.0% |
Reports | |
One Page Report | Download |
Manager Info
Name | Tenure |
---|---|
Christine Franquin | 1.67 yrs |
Michael Perre | 10.99 yrs |
Net Fund Flows
1M | 1.304B |
3M | 1.871B |
6M | 13.50B |
YTD | 21.03B |
1Y | 22.99B |
3Y | 107.28B |
5Y | 206.75B |
10Y | 297.60B |
Risk Info
Beta (5Y) | 0.968 |
Max Drawdown (All) | 26.98% |
Historical Sharpe Ratio (10Y) | -- |
Historical Sortino (All) | 0.2685 |
30-Day Rolling Volatility | 7.42% |
Daily Value at Risk (VaR) 1% (All) | 2.84% |
Monthly Value at Risk (VaR) 1% (All) | 10.84% |
Fundamentals
Dividend Yield TTM (12-9-19) | 2.90% |
30-Day SEC Yield | -- |
7-Day SEC Yield | -- |
Weighted Average PE Ratio | 15.02 |
Weighted Average Price to Sales Ratio | 1.154 |
Weighted Average Price to Book Ratio | 1.547 |
Weighted Median ROE | 15.39% |
Weighted Median ROA | 5.76% |
Forecasted Dividend Yield | 3.46% |
Forecasted PE Ratio | 14.09 |
Forecasted Price to Sales Ratio | 1.085 |
Forecasted Price to Book Ratio | 1.450 |
Number of Holdings | 7407 |
Growth Estimates
Forecasted 5 Yr Earnings Growth | 7.85% |
Forecasted Book Value Growth | 4.44% |
Forecasted Cash Flow Growth | 3.48% |
Forecasted Earnings Growth | 5.38% |
Forecasted Revenue Growth | 3.10% |
Attributes
Key Dates | |
---|---|
Inception Date | 1/26/2011 |
Termination Date | |
Last Annual Report Date | 10/31/2018 |
Last Prospectus Date | 2/26/2019 |
Attributes | |
Exchange Traded Share | Yes |
Exchange Traded Note | No |
Enhanced Index Fund | No |
Fixed Distribution Fund | No |
High-Net Worth Individual Fund | No |
Index Fund | Yes |
Inverse Fund | No |
Leveraged Fund | No |
Fund of Funds | No |
Currency Hedged Fund | No |
Synthetic Replication Fund | No |
Has Dividend Investment Plan | No |
Socially Responsible Fund | No |
General Availability | |
Available for Insurance Product | No |
Available for Retirement Plan | No |
Available for RRSP | No |
Advertisement