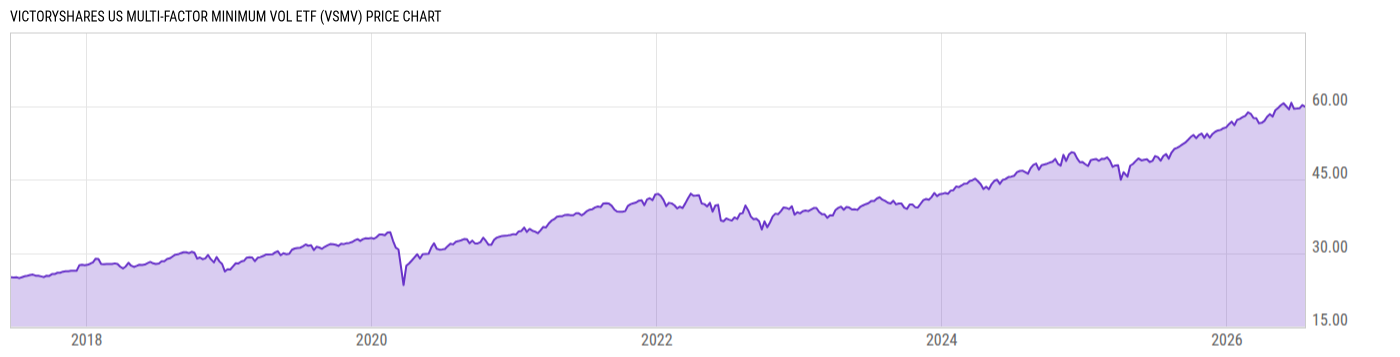
VictoryShares US Mult-Fctr Mnmm Vltl ETF (VSMV)
37.38
+0.35
(+0.95%)
USD |
NASDAQ |
Mar 20, 16:00
37.39
+0.01
(+0.03%)
After-Hours: 20:00
Key Stats
Expense Ratio | Discount or Premium to NAV | Total Assets Under Management | 30-Day Average Daily Volume |
---|---|---|---|
0.35% | 0.05% | 116.60M | 4214.93 |
Dividend Yield | Turnover Ratio | 1 Year Fund Level Flows | Max Drawdown (All) |
2.08% | 63.00% | -29.15M | Upgrade |
Basic Info
Investment Strategy | |
The investment seeks to provide investment results that track the performance of the Nasdaq Victory US Multi-Factor Minimum Volatility Index before fees and expenses. The fund seeks to achieve its investment objective by investing, under normal market conditions, at least 80% of its assets in securities included in the Nasdaq Victory US Multi-Factor Minimum Volatility Index (the "index"). The index utilizes a rules-based approach designed to generate investment returns with less volatility than the broader U.S. market. |
General | |
Security Type | Exchange-Traded Fund |
Equity Style | Large Cap/Value |
Fixed Income Style | -- |
Broad Asset Class | US Equity |
Broad Category | Equity |
Category Name | Large Value |
Category Index | Russell 1000 Value TR USD |
Global Category Name | US Equity Large Cap Blend |
YCharts Categorization | US Large Cap Blend |
YCharts Benchmark | S&P 500 Total Return (^SPXTR) |
Prospectus Objective | Growth and Income |
Fund Owner Firm Name | Victory Capital |
Prospectus Benchmark Index | |
Nasdaq Vict Multi-Factor Mini Vol TR USD | 100.0% |
Broad Asset Class Benchmark Index | |
^SPXTR | 100.0% |
Manager Tenure | |
Mannik Dhillon | 5.70 yrs |
Net Fund Flows Versus Category
1 Month
% Rank:
--
--
Category Low
--
Category High
1 Year
% Rank:
52
-29.15M
-6.415B
Category Low
13.81B
Category High
3 Months
% Rank:
--
--
Category Low
--
Category High
3 Years
% Rank:
--
--
Category Low
--
Category High
6 Months
% Rank:
--
--
Category Low
--
Category High
5 Years
% Rank:
--
--
Category Low
--
Category High
YTD
% Rank:
--
--
Category Low
--
Category High
10 Years
% Rank:
--
--
Category Low
--
Category High
As of February 28, 2023
Risk
Performance Versus Category
As of March 17, 2023. Returns for periods of 1 year and above are annualized.
Annual Total Returns Versus Peers
As of March 17, 2023.
Asset Allocation
Top 10 Holdings
Name | % Weight | Price | % Change |
---|---|---|---|
Microsoft Corp | 9.37% | 272.23 | -2.58% |
AbbVie Inc | 3.92% | 156.12 | 1.23% |
Johnson & Johnson | 3.76% | 153.89 | 0.99% |
Chevron Corp | 3.73% | 154.58 | 1.47% |
Lockheed Martin Corp | 3.68% | 475.70 | 2.11% |
Texas Instruments Inc | 3.60% | 179.16 | 1.96% |
Walmart Inc | 3.58% | 140.90 | 1.08% |
The Hershey Co | 3.17% | 244.54 | 0.57% |
Merck & Co Inc | 3.01% | 105.85 | 1.68% |
Bristol-Myers Squibb Co | 3.00% | 67.24 | 1.07% |
News
Headline
Wire
Time (ET)
Business Wire
08/10 09:00
Globe Newswire
07/10 10:00
Basic Info
Investment Strategy | |
The investment seeks to provide investment results that track the performance of the Nasdaq Victory US Multi-Factor Minimum Volatility Index before fees and expenses. The fund seeks to achieve its investment objective by investing, under normal market conditions, at least 80% of its assets in securities included in the Nasdaq Victory US Multi-Factor Minimum Volatility Index (the "index"). The index utilizes a rules-based approach designed to generate investment returns with less volatility than the broader U.S. market. |
General | |
Security Type | Exchange-Traded Fund |
Equity Style | Large Cap/Value |
Fixed Income Style | -- |
Broad Asset Class | US Equity |
Broad Category | Equity |
Category Name | Large Value |
Category Index | Russell 1000 Value TR USD |
Global Category Name | US Equity Large Cap Blend |
YCharts Categorization | US Large Cap Blend |
YCharts Benchmark | S&P 500 Total Return (^SPXTR) |
Prospectus Objective | Growth and Income |
Fund Owner Firm Name | Victory Capital |
Prospectus Benchmark Index | |
Nasdaq Vict Multi-Factor Mini Vol TR USD | 100.0% |
Broad Asset Class Benchmark Index | |
^SPXTR | 100.0% |
Manager Tenure | |
Mannik Dhillon | 5.70 yrs |
Fundamentals
General | |
Distribution Yield | Upgrade |
Dividend Yield TTM (3-20-23) | 2.08% |
30-Day SEC Yield (2-28-23) | Upgrade |
7-Day SEC Yield | -- |
Number of Holdings | Upgrade |
Stock | |
Weighted Average PE Ratio | 16.55 |
Weighted Average Price to Sales Ratio | Upgrade |
Weighted Average Price to Book Ratio | Upgrade |
Weighted Median ROE | Upgrade |
Weighted Median ROA | Upgrade |
Forecasted Dividend Yield | Upgrade |
Forecasted PE Ratio | Upgrade |
Forecasted Price to Sales Ratio | Upgrade |
Forecasted Price to Book Ratio | Upgrade |
As of March 17, 2023
Fund Details
Key Dates | |
Inception Date | 6/21/2017 |
Last Annual Report Date | 6/30/2022 |
Last Prospectus Date | 11/1/2022 |
Attributes | |
Index Fund |
|
Inverse Fund | No |
Leveraged Fund | No |
Fund of Funds | No |
Currency Hedged Fund | No |
Synthetic Replication Fund | No |
Has Dividend Investment Plan | No |
Socially Responsible Fund | No |
News
Headline
Wire
Time (ET)
Business Wire
08/10 09:00
Globe Newswire
07/10 10:00