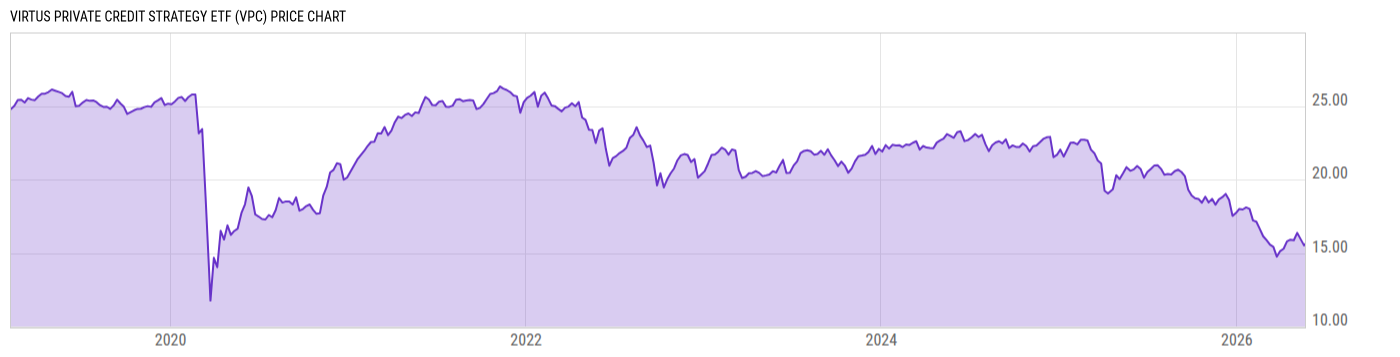
Virtus Private Credit ETF (VPC)
21.31
+0.31 (+1.47%)
USD |
NYSEARCA |
Jun 24, 16:00
21.30
-0.01 (-0.02%)
After-Hours: 20:00
Price Chart
Key Stats
Customize
Expense Ratio | Discount or Premium to NAV | Total Assets Under Management | 30-Day Average Daily Volume |
---|---|---|---|
6.46% | 0.02% | 28.76M | 10347.57 |
Dividend Yield | Turnover Ratio | 1 Year Fund Level Flows | Max Drawdown (All) |
9.26% | 34.00% | 9.397M | Upgrade |
Basic Info
Investment Strategy | |
The investment seeks investment results that correspond the price and yield performance of the Indxx Private Credit Index (the "underlying index"). Under normal market conditions, the fund will invest not less than 80% of its assets in component securities of the underlying index. The underlying index is designed to track the performance of U.S.-listed, registered closed-end investment companies that have elected to be regulated as "business development companies" under the Investment Company Act of 1940, as well as U.S.-listed, non-BDC registered closed-end funds. |
General | |
Security Type | Exchange-Traded Fund |
Equity Style | Small Cap/Value |
Fixed Income Style | Low Quality/Limited Sensitivity |
Broad Asset Class | Taxable Bond |
Broad Category | Fixed Income |
Category Name | Nontraditional Bond |
Category Index | ICE BofA USD 3M Dep OR CM TR USD |
Prospectus Objective | Growth and Income |
Fund Owner Firm Name | Virtus |
Prospectus Benchmark Index | |
Indxx Private Credit TR USD | 100.0% |
Broad Asset Class Benchmark Index | |
^BBUSATR | 100.0% |
Manager Tenure | |
Matthew Brown | 3.31 yrs |
Seth Kadushin | 3.31 yrs |
Net Fund Flows Versus Category
1 Month
% Rank:
--
--
Category Low
--
Category High
1 Year
% Rank:
44
9.397M
-1.067B
Category Low
5.285B
Category High
3 Months
% Rank:
--
--
Category Low
--
Category High
3 Years
% Rank:
--
--
Category Low
--
Category High
6 Months
% Rank:
--
--
Category Low
--
Category High
5 Years
% Rank:
--
--
Category Low
--
Category High
YTD
% Rank:
--
--
Category Low
--
Category High
10 Years
% Rank:
--
--
Category Low
--
Category High
As of May 31, 2022
Performance Versus Category
As of June 24, 2022. Returns for periods of 1 year and above are annualized.
Annual Total Returns Versus Peers
As of June 24, 2022.
Asset Allocation
Top 10 Holdings
Name | % Weight | Price | % Change |
---|---|---|---|
Oxford Lane Capital Corp | 3.44% | 5.66 | -0.53% |
Nuveen Credit Strategies Income | 3.30% | 5.29 | 0.57% |
FS KKR Capital Corp | 2.55% | 19.59 | 1.50% |
Eagle Point Credit Co LLC | 2.47% | 12.00 | 1.52% |
SLR Investment Corp | 2.36% | 14.90 | 0.81% |
Apollo Investment Corp | 2.34% | 10.90 | 1.49% |
BlackRock Capital Investment Corp | 2.31% | 3.66 | 1.10% |
XAI Octagon FR & Alt Income Term Trust | 2.22% | 7.35 | 3.23% |
KKR Income Opportunities | 2.20% | 11.80 | 0.25% |
Goldman Sachs BDC Inc | 2.17% | 17.67 | 1.49% |
News
Headline
Wire
Time (ET)
SA Breaking News
06/22 11:45
Basic Info
Investment Strategy | |
The investment seeks investment results that correspond the price and yield performance of the Indxx Private Credit Index (the "underlying index"). Under normal market conditions, the fund will invest not less than 80% of its assets in component securities of the underlying index. The underlying index is designed to track the performance of U.S.-listed, registered closed-end investment companies that have elected to be regulated as "business development companies" under the Investment Company Act of 1940, as well as U.S.-listed, non-BDC registered closed-end funds. |
General | |
Security Type | Exchange-Traded Fund |
Equity Style | Small Cap/Value |
Fixed Income Style | Low Quality/Limited Sensitivity |
Broad Asset Class | Taxable Bond |
Broad Category | Fixed Income |
Category Name | Nontraditional Bond |
Category Index | ICE BofA USD 3M Dep OR CM TR USD |
Prospectus Objective | Growth and Income |
Fund Owner Firm Name | Virtus |
Prospectus Benchmark Index | |
Indxx Private Credit TR USD | 100.0% |
Broad Asset Class Benchmark Index | |
^BBUSATR | 100.0% |
Manager Tenure | |
Matthew Brown | 3.31 yrs |
Seth Kadushin | 3.31 yrs |
Fundamentals
General | |
Distribution Yield | Upgrade |
Dividend Yield TTM (6-24-22) | 9.26% |
30-Day SEC Yield (5-31-22) | Upgrade |
7-Day SEC Yield | -- |
Number of Holdings | Upgrade |
Stock | |
Weighted Average PE Ratio | 6.994 |
Weighted Average Price to Sales Ratio | Upgrade |
Weighted Average Price to Book Ratio | Upgrade |
Weighted Median ROE | Upgrade |
Weighted Median ROA | Upgrade |
Forecasted Dividend Yield | Upgrade |
Forecasted PE Ratio | Upgrade |
Forecasted Price to Sales Ratio | Upgrade |
Forecasted Price to Book Ratio | Upgrade |
Bond | |
Current Yield | 6.69% |
Yield to Maturity | Upgrade |
Effective Duration | Upgrade |
Average Coupon | Upgrade |
Average Credit Score | Upgrade |
Average Price | Upgrade |
As of June 24, 2022
Risk Info
Fund Details
Key Dates | |
Inception Date | 2/7/2019 |
Last Annual Report Date | 10/31/2021 |
Last Prospectus Date | 2/28/2022 |
Attributes | |
Enhanced Index Fund | No |
Index Fund |
|
Inverse Fund | No |
Leveraged Fund | No |
Fund of Funds | No |
Currency Hedged Fund | No |
Synthetic Replication Fund | No |
Has Dividend Investment Plan | No |
Socially Responsible Fund | No |
News
Headline
Wire
Time (ET)
SA Breaking News
06/22 11:45