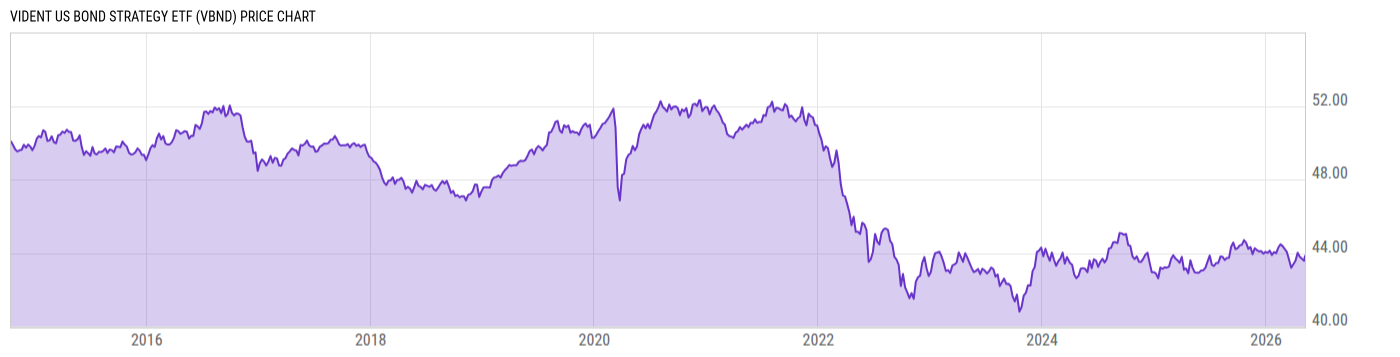
Key Stats

Expense Ratio Discount or Premium to NAV Total Assets Under Management 30-Day Average Daily Volume
0.41% 0.00% 374.00M 24601.03
Dividend Yield Turnover Ratio 1 Year Fund Level Flows Max Drawdown (All)
2.73% 247.0% 12.76M Upgrade

Basic Info

Investment Strategy
The investment seeks to track the performance, before fees and expenses, of the Vident Core U.S. Bond IndexTM. Under normal circumstances, at least 80% of the fund's total assets (exclusive of collateral held from securities lending) will be invested in the component securities of the index and TBA securities representing such component securities. The index seeks to improve the overall mix of credit quality, interest rate and yield as compared to traditional U.S. core bond indices.
General
Security Type Exchange-Traded Fund
Equity Style --
Fixed Income Style --
Broad Asset Class Taxable Bond
Broad Category Fixed Income
Category Name Intermediate Core-Plus Bond
Category Index Bloomberg US Universal TR USD
Global Category Name US Fixed Income
YCharts Categorization US Fixed Income
YCharts Benchmark Bloomberg US Aggregate (^BBUSATR)
Prospectus Objective Growth and Income
Fund Owner Firm Name Vident Financial
Prospectus Benchmark Index
Vident Core U.S. Bond TR USD 100.0%
Broad Asset Class Benchmark Index
^BBUSATR 100.0%
Manager Tenure
Jim Iredale 7.88 yrs
Jeffrey Kernagis 0.70 yrs

Net Fund Flows Versus Category

View Net Fund Flows. Upgrade now.
1M
3M
6M
YTD
1Y
3Y
5Y
10Y
 
80.00B
60.00B
40.00B
20.00B
0
-20.00B
1 Month
% Rank: --
-- Category Low
-- Category High
1 Year
% Rank: 26
12.76M
-8.753B Category Low
19.79B Category High
3 Months
% Rank: --
-- Category Low
-- Category High
3 Years
% Rank: --
-- Category Low
-- Category High
6 Months
% Rank: --
-- Category Low
-- Category High
5 Years
% Rank: --
-- Category Low
-- Category High
YTD
% Rank: --
-- Category Low
-- Category High
10 Years
% Rank: --
-- Category Low
-- Category High
As of February 28, 2023

Performance Versus Category

 
20%
15%
10%
5%
0
View Category Returns. Upgrade now.
Name
1M
3M
YTD
1Y
3Y
5Y
10Y
15Y
Total Return (Price)
--
--
--
--
--
--
--
--
Total Return (NAV)
--
--
--
--
--
--
--
--
Category Rtn. (NAV)
--
--
--
--
--
--
--
--
% Rank in Cat (NAV)
--
--
--
--
--
--
--
--
As of March 20, 2023. Returns for periods of 1 year and above are annualized.

Annual Total Returns Versus Peers

Loading chart...
Name
2016
2017
2018
2019
2020
2021
2022
YTD
2.20%
3.15%
-0.96%
9.49%
5.38%
-0.43%
-14.18%
2.91%
2.65%
3.54%
0.01%
8.72%
7.51%
-1.54%
-13.01%
2.41%
--
4.88%
-0.45%
8.62%
6.25%
-1.42%
-12.76%
2.49%
--
--
--
--
5.86%
-1.70%
-15.73%
2.86%
10.79%
12.01%
-9.55%
22.10%
12.22%
4.64%
-27.30%
3.02%
8.77%
14.38%
15.53%
1.61%
-16.15%
6.36%
-18.67%
7.79%
As of March 20, 2023.

Fundamentals

General
Distribution Yield Upgrade
Dividend Yield TTM (3-20-23) 2.73%
30-Day SEC Yield (2-28-23) Upgrade
7-Day SEC Yield --
Number of Holdings Upgrade
Bond
Current Yield 2.96%
Yield to Maturity --
Effective Duration --
Average Coupon Upgrade
Average Credit Score --
Average Price Upgrade
As of March 16, 2023

Asset Allocation

As of March 17, 2023.
Type % Net % Long % Short
Cash 0.70% Upgrade Upgrade
Stock 0.00% Upgrade Upgrade
Bond 98.99% Upgrade Upgrade
Convertible 0.00% Upgrade Upgrade
Preferred 0.30% Upgrade Upgrade
Other 0.00% Upgrade Upgrade

Top 10 Holdings

Name % Weight Price % Change
United States Treasury Notes 1.88%
4.54% -- --
United States Treasury Notes 0.38%
3.56% -- --
United States Treasury Notes 1.5%
3.41% -- --
United States Treasury Notes 2.5%
3.02% -- --
United States Treasury Notes 1.25%
2.91% -- --
United States Treasury Notes 2.75%
2.82% -- --
United States Treasury Notes 0.38%
2.81% -- --
United States Treasury Notes 1.13%
1.96% -- --
United States Treasury Notes 2.88%
1.89% -- --
United States Treasury Notes 1.75%
1.80% -- --

Basic Info

Investment Strategy
The investment seeks to track the performance, before fees and expenses, of the Vident Core U.S. Bond IndexTM. Under normal circumstances, at least 80% of the fund's total assets (exclusive of collateral held from securities lending) will be invested in the component securities of the index and TBA securities representing such component securities. The index seeks to improve the overall mix of credit quality, interest rate and yield as compared to traditional U.S. core bond indices.
General
Security Type Exchange-Traded Fund
Equity Style --
Fixed Income Style --
Broad Asset Class Taxable Bond
Broad Category Fixed Income
Category Name Intermediate Core-Plus Bond
Category Index Bloomberg US Universal TR USD
Global Category Name US Fixed Income
YCharts Categorization US Fixed Income
YCharts Benchmark Bloomberg US Aggregate (^BBUSATR)
Prospectus Objective Growth and Income
Fund Owner Firm Name Vident Financial
Prospectus Benchmark Index
Vident Core U.S. Bond TR USD 100.0%
Broad Asset Class Benchmark Index
^BBUSATR 100.0%
Manager Tenure
Jim Iredale 7.88 yrs
Jeffrey Kernagis 0.70 yrs

Fundamentals

General
Distribution Yield Upgrade
Dividend Yield TTM (3-20-23) 2.73%
30-Day SEC Yield (2-28-23) Upgrade
7-Day SEC Yield --
Number of Holdings Upgrade
Bond
Current Yield 2.96%
Yield to Maturity --
Effective Duration --
Average Coupon Upgrade
Average Credit Score --
Average Price Upgrade
As of March 16, 2023

Fund Details

Key Dates
Inception Date 10/15/2014
Last Annual Report Date 8/31/2022
Last Prospectus Date 12/31/2022
Attributes
Index Fund Yes
Inverse Fund No
Leveraged Fund No
Fund of Funds No
Currency Hedged Fund No
Synthetic Replication Fund No
Has Dividend Investment Plan No
Socially Responsible Fund No

Top Portfolio Holders

0 of 0