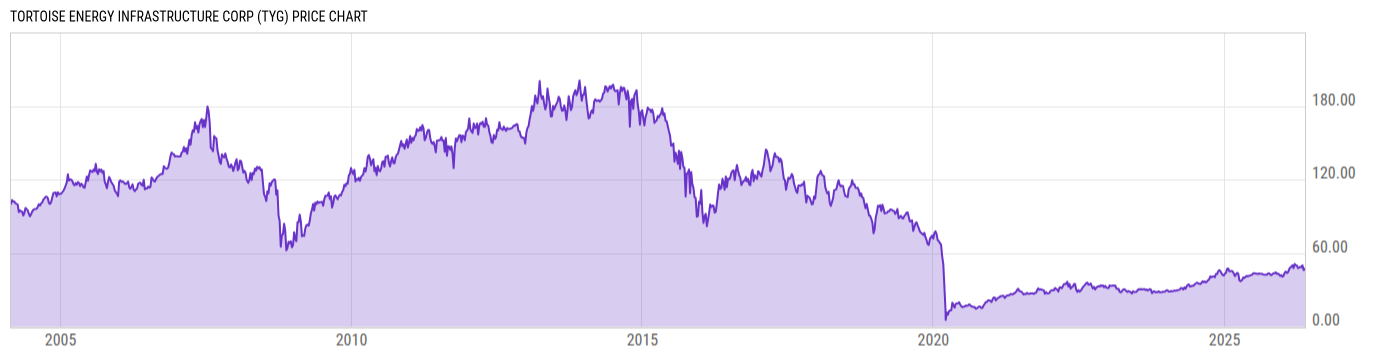
Tortoise Energy Infrastructure (TYG)
24.75
-0.13 (-0.52%)
USD |
Mar 08, 20:00
Price Chart
Key Stats
Customize
Expense Ratio | Discount or Premium to NAV | Total Assets Under Management | 30-Day Average Daily Volume |
---|---|---|---|
2.13% | -23.54% | 396.53M | 97289.93 |
Dividend Yield | Turnover Ratio | 1 Year Fund Level Flows | Max Drawdown (All) |
0.00% | 36.79% | -46.47M | Upgrade |
Basic Info
Investment Strategy | |
Under normal circumstances, the Company will invest at least 90% of total assets in securities of energy infrastructure companies, and will invest at least 70% of total assets in equity securities of MLPs. The Company may also invest up to 25% of total assets in debt securities of energy infrastructure companies, including securities rated below investment grade and up to 30% of total assets in restricted securities for which no public trading market exists. |
General | |
Security Type | Closed-End Fund |
Equity Style | Mid Cap/Value |
Fixed Income Style | -- |
Broad Asset Class | Sector Equity |
Broad Category | Equity |
Category Name | Energy Limited Partnership |
Category Index | Morningstar MLP Composite TR USD |
Prospectus Objective | Specialty - Natural Resources |
Fund Owner Firm Name | Tortoise Capital Advisors |
Prospectus Benchmark Index | |
S&P 500 TR USD | 100.0% |
Broad Asset Class Benchmark Index | |
^MSWNTR | 100.0% |
Manager Tenure | |
H. Kevin Birzer | 17.02 yrs |
Matthew Sallee | 5.67 yrs |
Nicholas Holmes | 5.67 yrs |
Net Fund Flows Versus Category
1 Month
% Rank:
--
--
Category Low
--
Category High
1 Year
% Rank:
53
-46.47M
-1.342B
Category Low
121.08M
Category High
3 Months
% Rank:
--
--
Category Low
--
Category High
3 Years
% Rank:
--
--
Category Low
--
Category High
6 Months
% Rank:
--
--
Category Low
--
Category High
5 Years
% Rank:
--
--
Category Low
--
Category High
YTD
% Rank:
--
--
Category Low
--
Category High
10 Years
% Rank:
--
--
Category Low
--
Category High
As of January 31, 2012
Performance Versus Category
As of March 08, 2021. Returns for periods of 1 year and above are annualized.
Annual Total Returns Versus Peers
Edit comparables
As of March 08, 2021.
Asset Allocation
Top 10 Holdings
Name | % Weight | Price | % Change |
---|---|---|---|
Enterprise Products Partners Lp | 9.75% | 23.07 | -0.39% |
Magellan Midstream Partners Lp | 9.32% | 45.00 | 0.27% |
Mplx Lp Partnership Units | 9.16% | 26.00 | 0.85% |
Williams Companies Inc | 7.54% | 24.12 | -0.58% |
Plains All American Pipeline Lp | 5.33% | 9.67 | -0.92% |
Oneok Inc | 4.57% | 49.54 | -0.06% |
Nextera Energy Partners Lp | 4.39% | 69.74 | 0.69% |
Energy Transfer Lp | 4.27% | 8.10 | -0.61% |
Kinder Morgan Inc Class P | 4.20% | 16.22 | 2.21% |
Nustar Energy Lp | 4.17% | 19.85 | 0.92% |
News
Headline
Wire
Time (ET)
Yahoo
03/01 22:00
Yahoo
02/09 17:53
Yahoo
02/01 22:28
Yahoo
01/28 23:43
Yahoo
01/04 22:54
MT Newswires
10/14 17:12
Basic Info
Investment Strategy | |
Under normal circumstances, the Company will invest at least 90% of total assets in securities of energy infrastructure companies, and will invest at least 70% of total assets in equity securities of MLPs. The Company may also invest up to 25% of total assets in debt securities of energy infrastructure companies, including securities rated below investment grade and up to 30% of total assets in restricted securities for which no public trading market exists. |
General | |
Security Type | Closed-End Fund |
Equity Style | Mid Cap/Value |
Fixed Income Style | -- |
Broad Asset Class | Sector Equity |
Broad Category | Equity |
Category Name | Energy Limited Partnership |
Category Index | Morningstar MLP Composite TR USD |
Prospectus Objective | Specialty - Natural Resources |
Fund Owner Firm Name | Tortoise Capital Advisors |
Prospectus Benchmark Index | |
S&P 500 TR USD | 100.0% |
Broad Asset Class Benchmark Index | |
^MSWNTR | 100.0% |
Manager Tenure | |
H. Kevin Birzer | 17.02 yrs |
Matthew Sallee | 5.67 yrs |
Nicholas Holmes | 5.67 yrs |
Fundamentals
General | |
Distribution Yield | Upgrade |
Dividend Yield TTM (3-8-21) | 0.00% |
30-Day SEC Yield | -- |
7-Day SEC Yield | -- |
Number of Holdings | Upgrade |
Stock | |
Weighted Average PE Ratio | 13.37 |
Weighted Average Price to Sales Ratio | Upgrade |
Weighted Average Price to Book Ratio | Upgrade |
Weighted Median ROE | Upgrade |
Weighted Median ROA | Upgrade |
Forecasted Dividend Yield | Upgrade |
Forecasted PE Ratio | Upgrade |
Forecasted Price to Sales Ratio | Upgrade |
Forecasted Price to Book Ratio | Upgrade |
As of December 31, 2020
Growth Estimates
Fund Details
Key Dates | |
Inception Date | 2/27/2004 |
Last Annual Report Date | 11/30/2020 |
Last Prospectus Date | 12/31/2013 |
Attributes | |
Enhanced Index Fund | No |
Index Fund | No |
Inverse Fund | No |
Leveraged Fund |
|
Fund of Funds | No |
Currency Hedged Fund | No |
Synthetic Replication Fund | No |
Has Dividend Investment Plan |
|
Socially Responsible Fund | No |
News
Headline
Wire
Time (ET)
Yahoo
03/01 22:00
Yahoo
02/09 17:53
Yahoo
02/01 22:28
Yahoo
01/28 23:43
Yahoo
01/04 22:54
MT Newswires
10/14 17:12