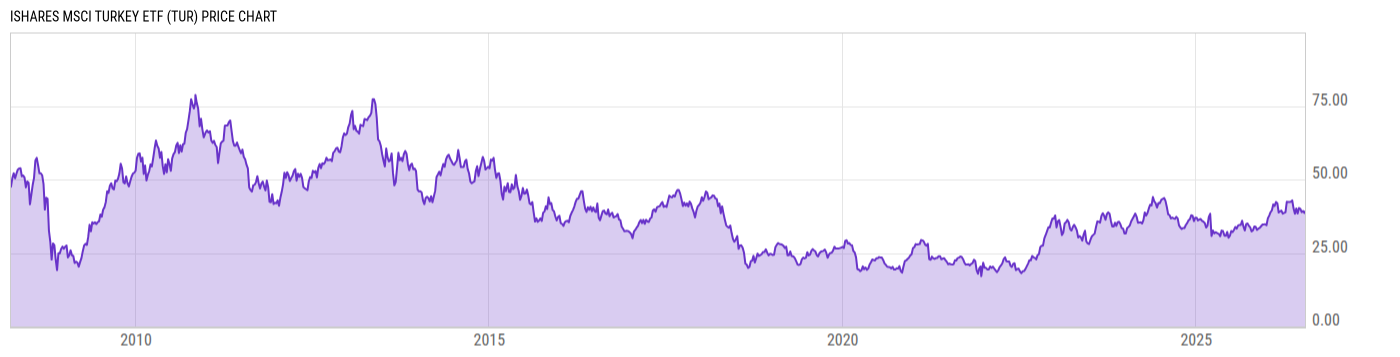
iShares MSCI Turkey ETF (TUR)
27.13
+0.09 +0.33%
NASDAQ
Dec 13, 20:00
Delayed 2m
USD
Key Stats
Expense Ratio | 0.59% |
Total Assets Under Management | 371.57M |
Share Class Assets Under Management | 371.57M |
30-Day Average Daily Volume | 391551.8 |
Net Asset Value | 27.12 |
Discount or Premium to NAV | 0.04% |
Turnover Ratio | 20.00% |
1 Year Fund Level Flows | -179.99M |
View All TUR News
News
-
WireHeadlineTime (ET)
-
Yahoo11/27 14:30
-
Yahoo11/25 14:49
-
Yahoo11/23 13:15
-
Yahoo11/22 14:52
-
Yahoo11/21 14:16
-
Yahoo10/23 16:24
-
Yahoo10/23 15:29
-
Yahoo10/23 14:24
-
Yahoo10/23 11:59
-
SA Breaking News10/23 11:58
Performance & Returns
Total Return (Price) | Total Return (NAV) | Cat. Total Return (NAV) | % Rank in Cat. (NAV) | |
---|---|---|---|---|
1M | 3.63% | 3.24% | -- | -- |
3M | 3.95% | 3.71% | -- | -- |
6M | 22.87% | 22.60% | -- | -- |
YTD | 13.31% | 12.76% | -- | -- |
1Y | 13.57% | 13.53% | -- | -- |
3Y | -3.01% | -2.94% | -- | -- |
5Y | -10.26% | -10.37% | -- | -- |
10Y | -3.84% | -3.88% | -- | -- |
15Y | -- | -- | -- | -- |
20Y | -- | -- | -- | -- |
Asset Allocation
Type | % Net | % Long | % Short |
---|---|---|---|
Cash | 0.20% | 0.20% | 0.00% |
Stock | 99.80% | 99.80% | 0.00% |
Bond | 0.00% | 0.00% | 0.00% |
Convertible | 0.00% | 0.00% | 0.00% |
Preferred | 0.00% | 0.00% | 0.00% |
Other | 0.00% | 0.00% | 0.00% |
Region Exposure
Americas | 0.00% |
North America | 0.00% |
Latin America | 0.00% |
Greater Europe | 100.0% |
United Kingdom | 0.00% |
Europe Developed | 0.00% |
Europe Emerging | 100.0% |
Africa/Middle East | 0.00% |
Greater Asia | 0.00% |
Japan | 0.00% |
Australasia | 0.00% |
Asia Developed | 0.00% |
Asia Emerging | 0.00% |
Market Classification | |
% Developed Markets | 0.00% |
% Emerging Markets | 100.0% |
Stock Sector Exposure
Basic Materials | 11.95% |
Communication Services | 4.42% |
Consumer Cyclical | 7.40% |
Consumer Defensive | 14.85% |
Energy | 6.03% |
Financial Services | 27.78% |
Healthcare | 1.74% |
Industrials | 20.86% |
Real Estate | 1.51% |
Technology | 1.98% |
Utilities | 1.48% |
Stock Market Capitalization
Giant | 0.00% |
Large | 0.00% |
Medium | 64.26% |
Small | 25.35% |
Micro | 10.39% |
Stock Style Exposure
Large Cap Value | 0.00% |
Large Cap Blend | 0.00% |
Large Cap Growth | 0.00% |
Mid Cap Value | 41.01% |
Mid Cap Blend | 17.34% |
Mid Cap Growth | 8.02% |
Small Cap Value | 5.10% |
Small Cap Blend | 8.94% |
Small Cap Growth | 19.59% |
View More Holdings
As of Dec. 12, 2019
Top 10 Holdings
Symbol | Name | % Weight | Price | % Chg |
---|---|---|---|---|
GARAN | Turkiye Garanti Bankasi AS | 9.98% | -- | -- |
AKBNK | Akbank TAS | 9.17% | -- | -- |
BIMAS | Bim Birlesik Magazalar AS | 7.75% | -- | -- |
KCHOL | Koc Holding AS | 6.10% | -- | -- |
TUPRS | Tupras-Turkiye Petrol Rafineleri AS | 6.02% | -- | -- |
EREGL | Eregli Demir Ve Celik Fabrikalari TAS | 5.08% | -- | -- |
TCELL | Turkcell Iletisim Hizmetleri AS | 4.41% | -- | -- |
THYAO | Turk Hava Yollari AO | 3.72% | -- | -- |
ASELS | Aselsan Elektronik Sanayi Ve Ticaret AS | 3.24% | -- | -- |
ISCTR | Turkiye Is Bankasi AS Class C | 3.19% | -- | -- |
Advertisement
Basic Info
Investment Strategy | |
---|---|
The investment seeks to track the investment results of the MSCI Turkey IMI 25/50 Index. The fund generally will invest at least 90% of its assets in the component securities of the underlying index and in investments that have economic characteristics that are substantially identical to the component securities of the underlying index. The underlying index consists of stocks traded primarily on the Istanbul Stock Exchange (ISE). The fund is non-diversified. | |
General | |
Security Type | Exchange-Traded Fund |
Equity Style | Mid Cap/Blend |
Fixed Income Style | -- |
Broad Asset Class | International Equity |
Broad Category | Equity |
Category Name | Miscellaneous Region |
Prospectus Objective | Foreign Stock |
Fund Owner Firm Name | iShares |
Benchmark Index | |
MSCI Turkey IMI 25-50 NR USD | 100.0% |
Reports | |
One Page Report | Download |
Manager Info
Name | Tenure |
---|---|
Alan Mason | 3.55 yrs |
Amy Whitelaw | 0.84 yrs |
Diane Hsiung | 11.61 yrs |
Greg Savage | 11.61 yrs |
Jennifer Hsui | 6.84 yrs |
Rachel Aguirre | 0.84 yrs |
Net Fund Flows
1M | -4.022M |
3M | 23.15M |
6M | -66.89M |
YTD | -171.42M |
1Y | -179.99M |
3Y | 34.52M |
5Y | 112.66M |
10Y | 237.87M |
Risk Info
Beta (5Y) | 1.092 |
Max Drawdown (All) | 71.59% |
Historical Sharpe Ratio (10Y) | 0.0356 |
Historical Sortino (All) | 0.0654 |
30-Day Rolling Volatility | 15.74% |
Daily Value at Risk (VaR) 1% (All) | 7.21% |
Monthly Value at Risk (VaR) 1% (All) | 27.53% |
Fundamentals
Dividend Yield TTM (12-13-19) | 2.46% |
30-Day SEC Yield (4-30-18) | 3.19% |
7-Day SEC Yield | -- |
Weighted Average PE Ratio | 8.440 |
Weighted Average Price to Sales Ratio | 0.6385 |
Weighted Average Price to Book Ratio | 1.054 |
Weighted Median ROE | 18.82% |
Weighted Median ROA | 5.68% |
Forecasted Dividend Yield | 6.20% |
Forecasted PE Ratio | 7.956 |
Forecasted Price to Sales Ratio | 0.5828 |
Forecasted Price to Book Ratio | 0.9371 |
Number of Holdings | 48 |
Growth Estimates
Forecasted 5 Yr Earnings Growth | 9.86% |
Forecasted Book Value Growth | 19.81% |
Forecasted Cash Flow Growth | 26.94% |
Forecasted Earnings Growth | 8.55% |
Forecasted Revenue Growth | 29.34% |
Attributes
Key Dates | |
---|---|
Inception Date | 3/26/2008 |
Termination Date | |
Last Annual Report Date | 8/31/2019 |
Last Prospectus Date | 5/29/2019 |
Attributes | |
Exchange Traded Share | Yes |
Exchange Traded Note | No |
Enhanced Index Fund | No |
Fixed Distribution Fund | No |
High-Net Worth Individual Fund | No |
Index Fund | Yes |
Inverse Fund | No |
Leveraged Fund | No |
Fund of Funds | No |
Currency Hedged Fund | No |
Synthetic Replication Fund | No |
Has Dividend Investment Plan | No |
Socially Responsible Fund | No |
General Availability | |
Available for Insurance Product | No |
Available for Retirement Plan | No |
Available for RRSP | No |
Advertisement