

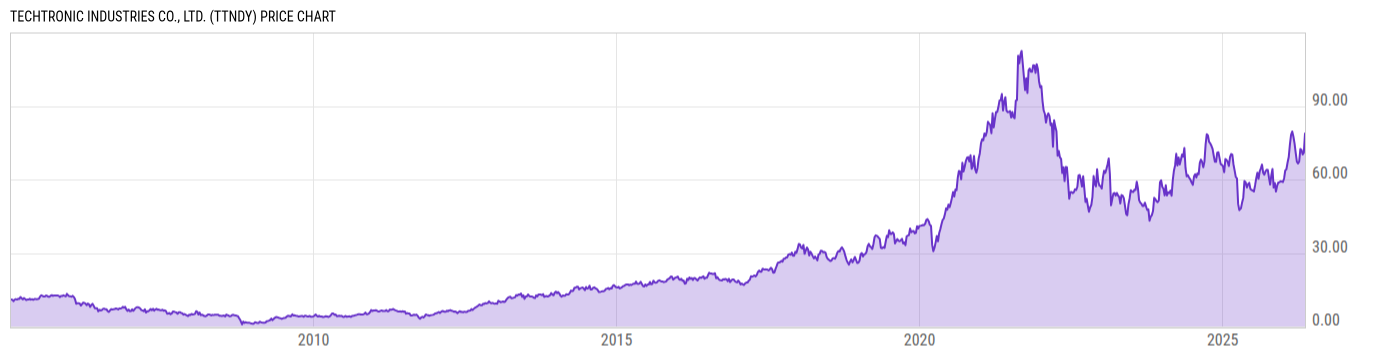
Techtronic Industries Co., Ltd. (TTNDY)
74.40
+1.28
(+1.74%)
USD |
OTCM |
May 29, 16:00
Price Chart
Key Stats
| Price and Performance | |
|---|---|
| Market Cap | 27.25B |
| 52 Week High (Daily) | |
| 52 Week Low (Daily) | |
| All-Time High (Daily) | |
| Year to Date Total Returns (Daily) | |
| 1 Month Total Returns (Daily) | |
| 1 Year Total Returns (Daily) | 32.03% |
| Valuation | |
| PE Ratio | 22.75 |
| PE Ratio (Forward) | |
| PS Ratio | 1.787 |
| Price to Book Value | -- |
| EV to EBITDA | |
| Dividend | |
|---|---|
| Dividend | 0.8428 |
| Dividend Yield (Forward) | |
| Financials | |
| Revenue (5 Year Growth) | |
| Revenue (Quarterly YoY Growth) | |
| EPS Diluted (5 Year Growth) | |
| EPS Diluted (Quarterly YoY Growth) | |
| Debt to Equity Ratio | -- |
| Return on Equity | |
| Return on Assets | |
| Risk | |
| Beta (5Y) | |
| Max Drawdown (5Y) | 59.91% |
Profile
| Techtronic Industries Co., Ltd. is an investment holding company, which engages in the manufacture and trade of electrical and electronic products. It operates through the Power Equipment, and Floorcare and Cleaning segments. The Power Equipment segment sells power tools, power tool accessories, outdoor products, and outdoor product accessories for consumer, trade, professional, and industrial users. The Floorcare and Cleaning segment is involved in the sale of floorcare products and floorcare accessories under the HOOVER, DIRT DEVIL, VAX, and ORECK brands. The company was founded by Chi Ping Chung and Horst Julius Pudwill in 1985 and is headquartered in Hong Kong. |
| URL | http://www.ttigroup.com |
| Investor Relations URL | https://ir.ttigroup.com/ |
| HQ State/Province | N/A |
| Sector | Industrials |
| Industry | Machinery |
| Next Earnings Release | Aug. 04, 2026 (est.) |
| Last Earnings Release | Mar. 03, 2026 |
| Next Ex-Dividend Date | N/A |
| Last Ex-Dividend Date | May. 15, 2026 |