

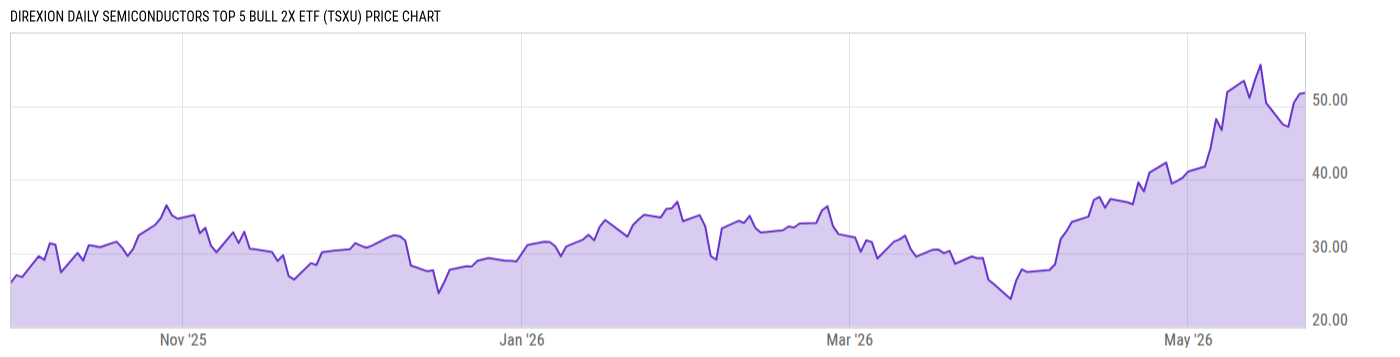
Direxion Daily Semiconductors Top 5 Bull 2X ETF (TSXU)
51.80
+0.16
(+0.31%)
USD |
NYSEARCA |
May 22, 16:00
51.26
-0.54
(-1.04%)
After-Hours: 20:00
Price Chart
Key Stats
| Net Expense Ratio | Discount or Premium to NAV | Total Assets Under Management | 30-Day Average Daily Volume |
|---|---|---|---|
| 0.97% | 0.12% | 10.32M | 18615.67 |
| Weighted Average Dividend Yield | Turnover Ratio (Generic) | 1 Year Fund Level Flows | Max Drawdown (Since Inception) |
| -- | -- | 6.370M |
Basic Info
| Investment Strategy | |
| The Fund seeks daily investment results, before fees and expenses, of 200% of the daily performance of the NYSE Semiconductor Top 5 Equal Weight Index. The return for investors that invest for periods longer or shorter than a trading day should not be expected to be 200% of the performance of the Index for the period. |
| General | |
| Security Type | Exchange-Traded Fund |
| Equity Style | -- |
| Broad Asset Class | Miscellaneous |
| Broad Category | Alternative Strategies |
| Global Peer Group | Alternative Equity Leveraged |
| Peer Group | Equity Leverage Funds |
| Global Macro | Alternative Equity |
| US Macro | Large-Cap Funds |
| YCharts Categorization | -- |
| YCharts Benchmark | -- |
| Prospectus Objective | Equity Leverage Funds |
| Fund Owner Firm Name | Direxion |
| Broad Asset Class Benchmark Index | |
| ^SPXTR | 100.0% |
Performance Versus Peer Group
Annual Total Returns Versus Peers
As of May 23, 2026.
Asset Allocation
As of April 30, 2026.
| Type | % Net |
|---|---|
| Cash | 6.75% |
| Stock | 18.82% |
| Bond | 54.36% |
| Convertible | 0.00% |
| Preferred | 0.00% |
| Other | 20.07% |
Basic Info
| Investment Strategy | |
| The Fund seeks daily investment results, before fees and expenses, of 200% of the daily performance of the NYSE Semiconductor Top 5 Equal Weight Index. The return for investors that invest for periods longer or shorter than a trading day should not be expected to be 200% of the performance of the Index for the period. |
| General | |
| Security Type | Exchange-Traded Fund |
| Equity Style | -- |
| Broad Asset Class | Miscellaneous |
| Broad Category | Alternative Strategies |
| Global Peer Group | Alternative Equity Leveraged |
| Peer Group | Equity Leverage Funds |
| Global Macro | Alternative Equity |
| US Macro | Large-Cap Funds |
| YCharts Categorization | -- |
| YCharts Benchmark | -- |
| Prospectus Objective | Equity Leverage Funds |
| Fund Owner Firm Name | Direxion |
| Broad Asset Class Benchmark Index | |
| ^SPXTR | 100.0% |