

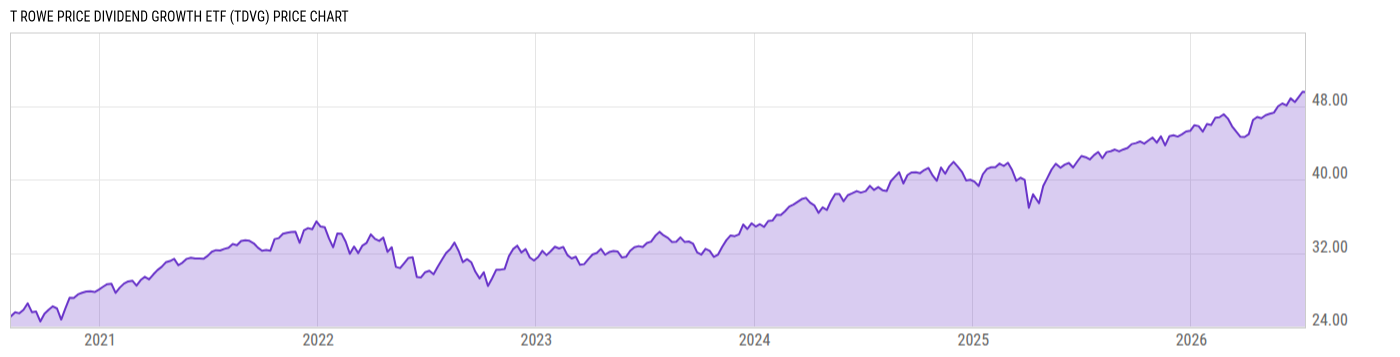
T Rowe Price Dividend Growth ETF (TDVG)
49.52
+0.13
(+0.26%)
USD |
NYSEARCA |
Jul 10, 16:00
49.56
+0.04
(+0.08%)
After-Hours: 20:00
Price Chart
Key Stats
| Net Expense Ratio | Discount or Premium to NAV | Total Assets Under Management | 30-Day Average Daily Volume |
|---|---|---|---|
| 0.50% | 0.04% | 1.388B | 44815.80 |
| Weighted Average Dividend Yield | Turnover Ratio (Generic) | 1 Year Fund Level Flows | Max Drawdown (Since Inception) |
| 1.56% | 17.00% | 309.49M |
Basic Info
| Investment Strategy | |
| The Fund seeks dividend income and long-term capital growth. The Fund normally invests at least 80% of the funds assets in stocks that have a strong track record of paying dividends or are expected to pay dividends over time, especially stocks with sustainable, above-average growth in earnings and dividends. |
| General | |
| Security Type | Exchange-Traded Fund |
| Equity Style | Large Cap Core |
| Broad Asset Class | US Equity |
| Broad Category | Equity |
| Global Peer Group | Equity US |
| Peer Group | Large-Cap Core Funds |
| Global Macro | Equity North America |
| US Macro | Large-Cap Funds |
| YCharts Categorization | -- |
| YCharts Benchmark | -- |
| Prospectus Objective | Growth & Income Funds |
| Fund Owner Firm Name | T. Rowe Price |
| Broad Asset Class Benchmark Index | |
| ^SPXTR | 100.0% |
Performance Versus Peer Group
Annual Total Returns Versus Peers
As of July 11, 2026.
Asset Allocation
As of March 31, 2026.
| Type | % Net |
|---|---|
| Cash | 0.38% |
| Stock | 99.14% |
| Bond | 0.39% |
| Convertible | 0.00% |
| Preferred | 0.00% |
| Other | 0.09% |
Basic Info
| Investment Strategy | |
| The Fund seeks dividend income and long-term capital growth. The Fund normally invests at least 80% of the funds assets in stocks that have a strong track record of paying dividends or are expected to pay dividends over time, especially stocks with sustainable, above-average growth in earnings and dividends. |
| General | |
| Security Type | Exchange-Traded Fund |
| Equity Style | Large Cap Core |
| Broad Asset Class | US Equity |
| Broad Category | Equity |
| Global Peer Group | Equity US |
| Peer Group | Large-Cap Core Funds |
| Global Macro | Equity North America |
| US Macro | Large-Cap Funds |
| YCharts Categorization | -- |
| YCharts Benchmark | -- |
| Prospectus Objective | Growth & Income Funds |
| Fund Owner Firm Name | T. Rowe Price |
| Broad Asset Class Benchmark Index | |
| ^SPXTR | 100.0% |