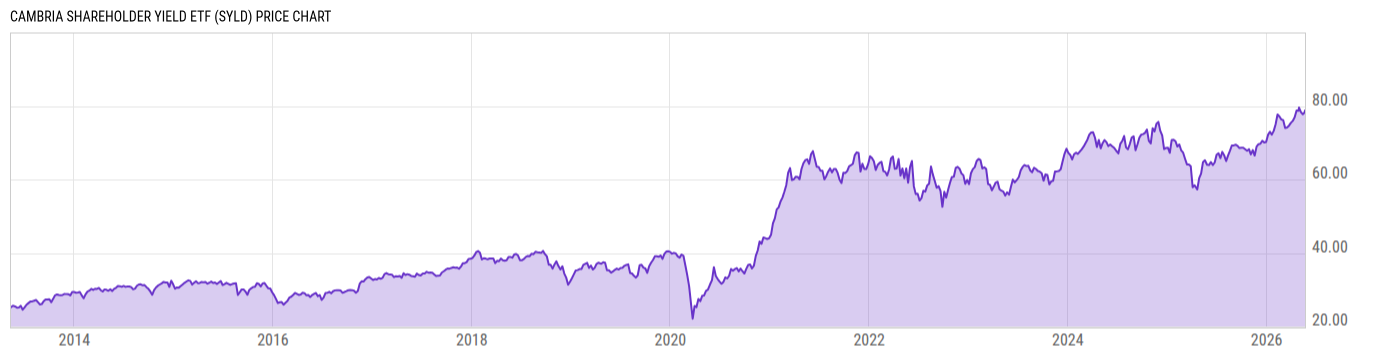
Cambria Shareholder Yield ETF (SYLD)
38.37
-0.13 -0.34%
NYSE Arca
Apr 19, 20:00
Delayed 2m
USD
SYLD Key Stats
Net Asset Value | Upgrade |
Discount or Premium to NAV | Upgrade |
Turnover Ratio | Upgrade |
View All SYLD News
SYLD News
-
WireHeadlineTime (ET)
-
SA Breaking News03/01 14:35
-
SA Breaking News02/26 09:35
-
SA Breaking News12/21 14:30
-
Business Wire11/29 09:00
-
SA Breaking News11/20 10:33
-
SA Breaking News08/15 07:28
-
Business Wire05/24 10:24
-
SA Breaking News05/01 11:04
-
SA Breaking News01/24 13:03
-
SA Breaking News01/05 14:26
SYLD Performance
Total Return (Price) | Total Return (NAV) | Cat. Total Return (NAV) | % Rank in Cat. (NAV) | |
---|---|---|---|---|
1M | 0.66% | 0.37% | -0.52% | 47 |
3M | -4.91% | -4.89% | -2.89% | 72 |
6M | 7.63% | 7.51% | 4.65% | 11 |
YTD | 0.24% | 0.37% | 0.00% | 37 |
1Y | 17.06% | 16.99% | 11.01% | 7 |
3Y | 10.17% | 10.14% | 7.41% | 14 |
5Y | -- | -- | 11.37% | -- |
10Y | -- | -- | 8.56% | -- |
SYLD Asset Allocation
Type | % Net | % Long | % Short |
---|---|---|---|
Cash | 0.14% | 0.14% | 0.00% |
Stock | 99.86% | 99.86% | 0.00% |
Bond | 0.00% | 0.00% | 0.00% |
Convertible | 0.00% | 0.00% | 0.00% |
Preferred | 0.00% | 0.00% | 0.00% |
Other | 0.00% | 0.00% | 0.00% |
SYLD Region Exposure
Americas | 100.0% |
North America | 100.0% |
Latin America | 0.00% |
Greater Europe | 0.00% |
United Kingdom | 0.00% |
Europe Developed | 0.00% |
Europe Emerging | 0.00% |
Africa/Middle East | 0.00% |
Greater Asia | 0.00% |
Japan | 0.00% |
Australasia | 0.00% |
Asia Developed | 0.00% |
Asia Emerging | 0.00% |
Market Classification | |
% Developed Markets | 100.0% |
% Emerging Markets | 0.00% |
SYLD Stock Sector Exposure
Basic Materials | 5.38% |
Communication Services | 0.00% |
Consumer Cyclical | 26.84% |
Consumer Defensive | 3.70% |
Energy | 3.29% |
Financial Services | 30.03% |
Healthcare | 4.03% |
Industrials | 15.33% |
Real Estate | 0.54% |
Technology | 10.22% |
Utilities | 0.64% |
SYLD Stock Market Capitalization
Giant | 9.61% |
Large | 41.47% |
Medium | 31.24% |
Small | 16.47% |
Micro | 1.20% |
SYLD Stock Style Exposure
Large Cap Value | 26.22% |
Large Cap Blend | 17.12% |
Large Cap Growth | 8.24% |
Mid Cap Value | 23.54% |
Mid Cap Blend | 7.14% |
Mid Cap Growth | 0.84% |
Small Cap Value | 9.46% |
Small Cap Blend | 6.22% |
Small Cap Growth | 1.23% |
View More Holdings
As of April 18, 2018
SYLD Top 10 Holdings
Symbol | Name | % Weight | Price | % Chg |
---|---|---|---|---|
TXN | Texas Instruments Inc | 1.85% | 99.93 | -1.34% |
HD | The Home Depot Inc | 1.70% | 178.72 | +0.93% |
AAPL | Apple Inc | 1.63% | 167.52 | -3.06% |
DPS | Dr Pepper Snapple Group Inc | 1.58% | 120.45 | +0.01% |
AEO | American Eagle Outfitters Inc | 1.50% | 20.93 | -1.69% |
ALL | Allstate Corp | 1.45% | 98.62 | +0.65% |
STI | SunTrust Banks Inc | 1.42% | 67.25 | +0.33% |
UAL | United Continental Holdings Inc | 1.40% | 72.25 | +2.88% |
LOW | Lowe's Companies Inc | 1.40% | 84.92 | +0.05% |
LUV | Southwest Airlines Co | 1.39% | 54.79 | -0.02% |
Advertisement
SYLD One Page Reports
- One Page Report Download
SYLD Basic Info
Style | |
---|---|
Equity Style | Mid Cap/Value |
Broad Asset Class | US Equity |
Broad Category | Equity |
Category Name | Mid-Cap Value |
Prospectus Objective | Growth and Income |
Fund Owner Firm Name | CAMBRIA ETF TRUST |
Benchmark Index | |
---|---|
Cambria Shareholder Yield TR USD |
100.0% |
SYLD Manager Info
Name | Tenure |
---|---|
Eric Richardson | 4.39 yrs |
Mebane Faber | 4.39 yrs |
SYLD Net Fund Flows
1M | 34.97M |
3M | 40.68M |
6M | 53.67M |
YTD | 40.68M |
1Y | 30.00M |
3Y | -58.30M |
5Y | -- |
10Y | -- |
SYLD Risk Info
Beta (5Y) | 1.064 |
Max Drawdown (All) | 16.63% |
Historical Sharpe (10Y) | -- |
Historical Sortino (All) | 1.773 |
30-Day Rolling Volatility | 20.72% |
Daily Value at Risk (VaR) 1% (All) | 2.40% |
Monthly Value at Risk (VaR) 1% (All) | 8.10% |
SYLD Fundamentals
Dividend Yield TTM (4-19-18) | 1.41% |
SEC Yield (3-31-18) | 1.41% |
Weighted Average PE Ratio | 13.80 |
Weighted Average Price to Sales Ratio | 0.9143 |
Weighted Average Price to Book Ratio | 1.974 |
Weighted Median ROE | 19.97% |
Weighted Median ROA | 6.84% |
Forecasted Dividend Yield | 2.35% |
Forecasted PE Ratio | 12.44 |
Forecasted Price to Sales Ratio | 0.8924 |
Forecasted Price to Book Ratio | 1.865 |
Number of Holdings | 123 |
SYLD Growth Estimates
Forecasted 5 Yr Earnings Growth | 11.68% |
Forecasted Book Value Growth | 4.05% |
Forecasted Cash Flow Growth | -2.85% |
Forecasted Earnings Growth | 3.19% |
Forecasted Revenue Growth | 2.98% |
SYLD Attributes
Key Dates | |
---|---|
Inception Date | 5/13/2013 |
Termination Date | |
Last Annual Report Date | 4/30/2017 |
Last Prospectus Date | 3/26/2018 |
Attributes | |
Exchange Traded Share | Yes |
Exchange Traded Note | No |
Enhanced Index Fund | No |
Index Fund | Yes |
Inverse Fund | No |
Leveraged Fund | No |
Fund of Funds | No |
Currency Hedged Fund | No |
Synthetic Replication Fund | No |
Has Dividend Investment Plan | No |
General Availability | |
Available for Insurance Product | No |
Available for Retirement Plan | No |
Available for RRSP | No |
SYLD Excel Add-In Codes
- Name: =YCI("SYLD","name")
- Broad Asset Class: =YCI("SYLD", "broad_asset_class")
- Broad Category: =YCI("SYLD", "broad_category_group")
- Prospectus Objective: =YCI("SYLD", "prospectus_objective")
To find the codes for any of our financial metrics, see our Complete Reference of Metric Codes.
Access our powerful Excel Add-in with a YCharts Professional Membership. Learn More.
Advertisement