

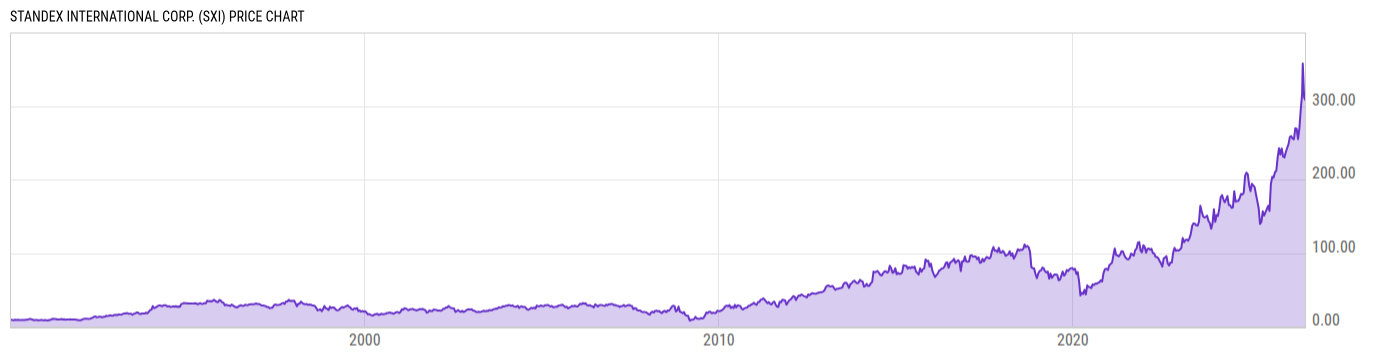
Standex International Corp. (SXI)
308.50
-1.30
(-0.42%)
USD |
NYSE |
Jul 23, 16:00
308.50
0.00 (0.00%)
After-Hours: 17:42
Price Chart
Key Stats
| Price and Performance | |
|---|---|
| Market Cap | 3.717B |
| 52 Week High (Daily) | |
| 52 Week Low (Daily) | |
| All-Time High (Daily) | |
| Year to Date Total Returns (Daily) | |
| 1 Month Total Returns (Daily) | |
| 1 Year Total Returns (Daily) | 98.35% |
| Valuation | |
| PE Ratio | 37.59 |
| PE Ratio (Forward) | |
| PS Ratio | 4.202 |
| Price to Book Value | 4.929 |
| EV to EBITDA | |
| Dividend | |
|---|---|
| Dividend | 0.34 |
| Dividend Yield (Forward) | |
| Financials | |
| Revenue (5 Year Growth) | |
| Revenue (Quarterly YoY Growth) | |
| EPS Diluted (5 Year Growth) | |
| EPS Diluted (Quarterly YoY Growth) | |
| Debt to Equity Ratio | 0.692 |
| Return on Equity | |
| Return on Assets | |
| Risk | |
| Beta (5Y) | |
| Max Drawdown (5Y) | 38.00% |
Profile
| Standex International Corp. engages in the provision of products and services for commercial and industrial markets. It operates through the following segments: Electronics, Engraving, Scientific, Engineering Technologies, and Specialty Solutions. The Electronics segment is involved in the manufacturing and selling of electronic components for applications throughout the end-user market spectrum. The Engraving segment provides mold texturizing, slush molding tools, project management and design services, roll engraving, hygiene product tooling, low observation vents for stealth aircraft, and process machinery. The Scientific segment includes temperature-controlled equipment for the medical, scientific, pharmaceutical, biotech and industrial markets. The Engineering Technologies segment offers net and near net formed single-source customized solutions in the manufacture of engineered components for the aviation, aerospace, defense, energy, industrial, medical, marine, oil and gas, and manned and unmanned space markets. The Specialty Solutions segment refers to the manufacture and sale of refrigerated, heated and dry merchandizing display cases, custom fluid pump solutions, and single and double acting telescopic and piston rod hydraulic cylinders. The company was founded by John Bolten in 1955 and is headquartered in Salem, NH. |
| URL | http://www.standex.com |
| Investor Relations URL | https://ir.standex.com/ |
| HQ State/Province | New Hampshire |
| Sector | Industrials |
| Industry | Machinery |
| Equity Style | Small Cap Core |
| Next Earnings Release | Jul. 30, 2026 (est.) |
| Last Earnings Release | Apr. 30, 2026 |
| Next Ex-Dividend Date | N/A |
| Last Ex-Dividend Date | May. 08, 2026 |