

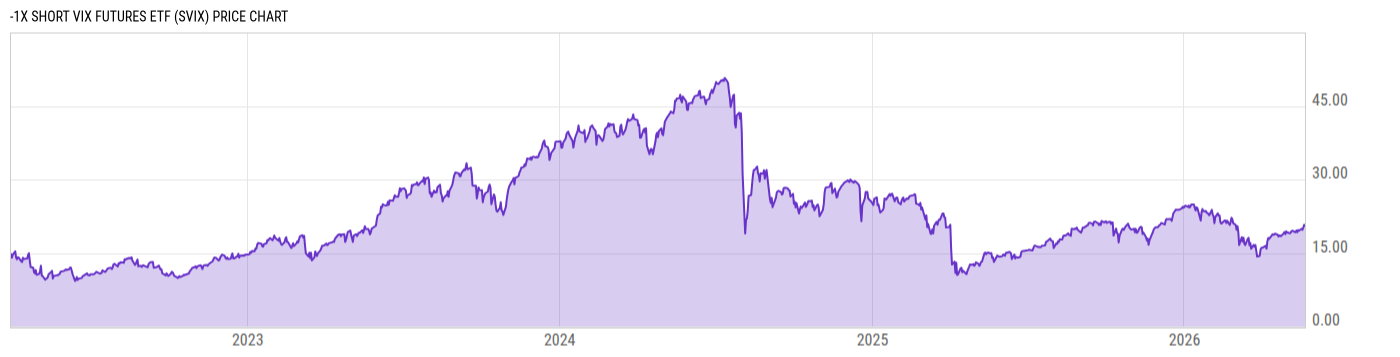
-1x Short VIX Futures ETF (SVIX)
20.59
-0.15
(-0.72%)
USD |
BATS |
May 22, 16:00
20.56
-0.03
(-0.15%)
Pre-Market: 20:00
Price Chart
Key Stats
| Net Expense Ratio | Discount or Premium to NAV | Total Assets Under Management | 30-Day Average Daily Volume |
|---|---|---|---|
| 1.84% | -0.18% | 180.48M | 3.145M |
| Weighted Average Dividend Yield | Turnover Ratio (Generic) | 1 Year Fund Level Flows | Max Drawdown (Since Inception) |
| -- | -- | -577.45M |
Basic Info
| Investment Strategy | |
| The Fund seeks daily investment results that correspond to the performance of the Short VIX Futures Index for a single day. The Index measures the daily inverse performance of a portfolio of first and second month VIX futures contracts. The Fund typically has exposure intended to approximate the Index. |
| General | |
| Security Type | Exchange-Traded Fund |
| Equity Style | -- |
| Broad Asset Class | Alternative |
| Broad Category | Alternative Strategies |
| Global Peer Group | Alternative Dedicated Short Bias |
| Peer Group | Dedicated Short Bias Funds |
| Global Macro | Liquid Alternatives |
| US Macro | Alternative Equity Funds |
| YCharts Categorization | -- |
| YCharts Benchmark | -- |
| Prospectus Objective | Dedicated Short Bias Funds |
| Fund Owner Firm Name | Volatility Shares |
| Broad Asset Class Benchmark Index | |
| ^MSACWINTR | 100.0% |
Performance Versus Peer Group
Annual Total Returns Versus Peers
As of May 23, 2026.
Asset Allocation
As of April 30, 2026.
| Type | % Net |
|---|---|
| Cash | 28.38% |
| Stock | 0.00% |
| Bond | 0.00% |
| Convertible | 0.00% |
| Preferred | 0.00% |
| Other | 71.62% |
Basic Info
| Investment Strategy | |
| The Fund seeks daily investment results that correspond to the performance of the Short VIX Futures Index for a single day. The Index measures the daily inverse performance of a portfolio of first and second month VIX futures contracts. The Fund typically has exposure intended to approximate the Index. |
| General | |
| Security Type | Exchange-Traded Fund |
| Equity Style | -- |
| Broad Asset Class | Alternative |
| Broad Category | Alternative Strategies |
| Global Peer Group | Alternative Dedicated Short Bias |
| Peer Group | Dedicated Short Bias Funds |
| Global Macro | Liquid Alternatives |
| US Macro | Alternative Equity Funds |
| YCharts Categorization | -- |
| YCharts Benchmark | -- |
| Prospectus Objective | Dedicated Short Bias Funds |
| Fund Owner Firm Name | Volatility Shares |
| Broad Asset Class Benchmark Index | |
| ^MSACWINTR | 100.0% |