

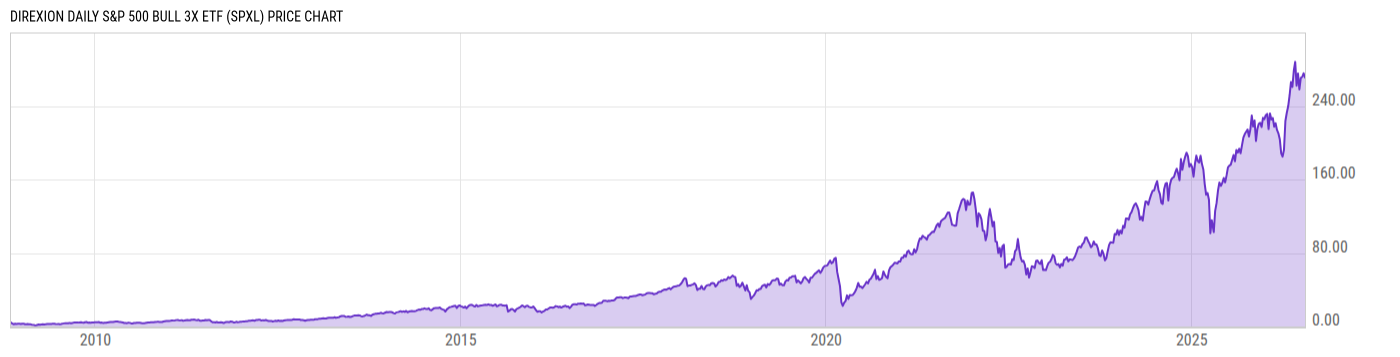
Direxion Daily S&P 500 Bull 3X ETF (SPXL)
270.95
+6.41
(+2.42%)
USD |
NYSEARCA |
Jul 21, 16:00
270.73
-0.22
(-0.08%)
After-Hours: 20:00
Price Chart
Key Stats
| Net Expense Ratio | Discount or Premium to NAV | Total Assets Under Management | 30-Day Average Daily Volume |
|---|---|---|---|
| 0.84% | 0.12% | 6.646B | 2.069M |
| Weighted Average Dividend Yield | Turnover Ratio (Generic) | 1 Year Fund Level Flows | Max Drawdown (Since Inception) |
| 1.13% | 71.00% | -1.239B |
Basic Info
| Investment Strategy | |
| The Fund seeks daily investment results, before fees and expenses, of 300% of the performance of the S&P 500 Index. The Fund seeks daily leveraged investment results and does not seek to achieve its stated investment objective over a period of time greater than one day. |
| General | |
| Security Type | Exchange-Traded Fund |
| Equity Style | Large Cap Core |
| Broad Asset Class | Miscellaneous |
| Broad Category | Alternative Strategies |
| Global Peer Group | Alternative Equity Leveraged |
| Peer Group | Equity Leverage Funds |
| Global Macro | Alternative Equity |
| US Macro | Large-Cap Funds |
| YCharts Categorization | -- |
| YCharts Benchmark | -- |
| Prospectus Objective | Equity Leverage Funds |
| Fund Owner Firm Name | Direxion |
| Broad Asset Class Benchmark Index | |
| ^SPXTR | 100.0% |
Performance Versus Peer Group
Annual Total Returns Versus Peers
As of July 21, 2026.
Asset Allocation
As of June 30, 2026.
| Type | % Net |
|---|---|
| Cash | -11.92% |
| Stock | 73.03% |
| Bond | 22.60% |
| Convertible | 0.00% |
| Preferred | 0.00% |
| Other | 16.29% |
Basic Info
| Investment Strategy | |
| The Fund seeks daily investment results, before fees and expenses, of 300% of the performance of the S&P 500 Index. The Fund seeks daily leveraged investment results and does not seek to achieve its stated investment objective over a period of time greater than one day. |
| General | |
| Security Type | Exchange-Traded Fund |
| Equity Style | Large Cap Core |
| Broad Asset Class | Miscellaneous |
| Broad Category | Alternative Strategies |
| Global Peer Group | Alternative Equity Leveraged |
| Peer Group | Equity Leverage Funds |
| Global Macro | Alternative Equity |
| US Macro | Large-Cap Funds |
| YCharts Categorization | -- |
| YCharts Benchmark | -- |
| Prospectus Objective | Equity Leverage Funds |
| Fund Owner Firm Name | Direxion |
| Broad Asset Class Benchmark Index | |
| ^SPXTR | 100.0% |