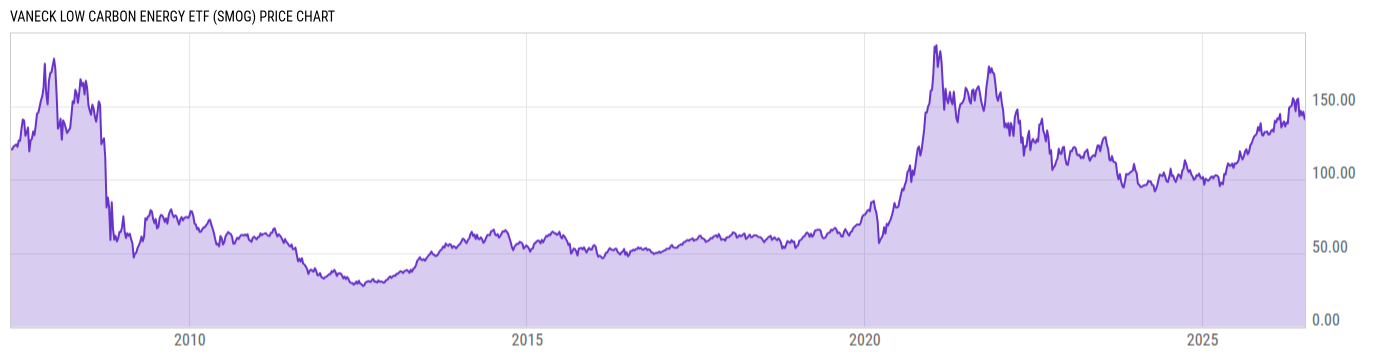
Key Stats

Expense Ratio Discount or Premium to NAV Total Assets Under Management 30-Day Average Daily Volume
0.61% -0.15% 210.92M 4004.33
Dividend Yield Turnover Ratio 1 Year Fund Level Flows Max Drawdown (All)
1.20% 16.00% -19.42M Upgrade

Basic Info

Investment Strategy
The investment seeks to replicate as closely as possible, before fees and expenses, the price and yield performance of the MVIS Global Low Carbon Energy Index. The fund normally invests at least 80% of its total assets in stocks of low carbon energy companies. Such companies may include small- and medium-capitalization companies and foreign issuers. “Low carbon energy companies” refers to companies primarily engaged in renewable energy, including renewable energy production, alternative fuels, electric vehicles, and related technologies and building materials (such as advanced batteries). It is non-diversified.
General
Security Type Exchange-Traded Fund
Equity Style Large Cap/Growth
Fixed Income Style --
Broad Asset Class Sector Equity
Broad Category Equity
Category Name Miscellaneous Sector
Category Index Morningstar US Market TR USD
Global Category Name Equity Miscellaneous
YCharts Categorization Other
YCharts Benchmark S&P 500 Total Return (^SPXTR)
Prospectus Objective Specialty - Natural Resources
Fund Owner Firm Name VanEck
Prospectus Benchmark Index
MVIS Global Low Carbon Energy TR USD 100.0%
Broad Asset Class Benchmark Index
^MSWNTR 100.0%
Manager Tenure
Peter Liao 15.84 yrs

Net Fund Flows Versus Category

View Net Fund Flows. Upgrade now.
1M
3M
6M
YTD
1Y
3Y
5Y
10Y
 
80.00B
60.00B
40.00B
20.00B
0
-20.00B
1 Month
% Rank: --
-- Category Low
-- Category High
1 Year
% Rank: 82
-19.42M
-1.348B Category Low
220.79M Category High
3 Months
% Rank: --
-- Category Low
-- Category High
3 Years
% Rank: --
-- Category Low
-- Category High
6 Months
% Rank: --
-- Category Low
-- Category High
5 Years
% Rank: --
-- Category Low
-- Category High
YTD
% Rank: --
-- Category Low
-- Category High
10 Years
% Rank: --
-- Category Low
-- Category High
As of February 28, 2023

Performance Versus Category

 
20%
15%
10%
5%
0
View Category Returns. Upgrade now.
Name
1M
3M
YTD
1Y
3Y
5Y
10Y
15Y
Total Return (Price)
--
--
--
--
--
--
--
--
Total Return (NAV)
--
--
--
--
--
--
--
--
Category Rtn. (NAV)
--
--
--
--
--
--
--
--
% Rank in Cat (NAV)
--
--
--
--
--
--
--
--
As of March 31, 2023. Returns for periods of 1 year and above are annualized.

Annual Total Returns Versus Peers

Loading chart...
Name
2016
2017
2018
2019
2020
2021
2022
YTD
-5.92%
22.67%
-10.17%
38.86%
118.4%
-2.74%
-29.91%
9.61%
7.51%
22.40%
-8.71%
27.67%
15.90%
21.82%
-18.14%
7.73%
--
--
--
--
--
3.02%
-19.26%
9.82%
9.33%
16.31%
-11.37%
31.18%
61.18%
-11.65%
-13.11%
3.36%
-7.08%
28.70%
-19.30%
40.01%
145.4%
-22.29%
-29.69%
7.83%
22.69%
27.43%
-22.69%
42.83%
48.82%
27.64%
-13.89%
12.04%
As of March 31, 2023.

Fundamentals

General
Distribution Yield Upgrade
Dividend Yield TTM (3-31-23) 1.20%
30-Day SEC Yield (3-27-23) Upgrade
7-Day SEC Yield --
Number of Holdings Upgrade
Stock
Weighted Average PE Ratio 22.01
Weighted Average Price to Sales Ratio Upgrade
Weighted Average Price to Book Ratio Upgrade
Weighted Median ROE Upgrade
Weighted Median ROA Upgrade
Forecasted Dividend Yield Upgrade
Forecasted PE Ratio Upgrade
Forecasted Price to Sales Ratio Upgrade
Forecasted Price to Book Ratio Upgrade
As of March 29, 2023

Growth Estimates

Forecasted 5 Yr Earnings Growth Upgrade
Forecasted Book Value Growth Upgrade
Forecasted Cash Flow Growth Upgrade
Forecasted Earnings Growth Upgrade
Forecasted Revenue Growth Upgrade
As of March 29, 2023

Asset Allocation

As of March 29, 2023.
Type % Net % Long % Short
Cash 0.86% Upgrade Upgrade
Stock 99.14% Upgrade Upgrade
Bond 0.00% Upgrade Upgrade
Convertible 0.00% Upgrade Upgrade
Preferred 0.00% Upgrade Upgrade
Other 0.00% Upgrade Upgrade

Top 10 Holdings

Name % Weight Price % Change
Tesla Inc 8.39% 207.50 6.26%
NextEra Energy Inc 8.08% 77.08 0.64%
Iberdrola SA 7.48% 12.48 -0.04%
Enel SpA 6.82% 6.085 0.00%
Samsung SDI Co Ltd
5.84% -- --
Vestas Wind Systems A/S 5.01% 28.96 0.35%
BYD Co Ltd Class H 4.15% 29.40 0.52%
Enphase Energy Inc 4.12% 210.28 2.44%
First Solar Inc 3.35% 217.50 1.96%
NIBE Industrier AB Class B 3.02% 11.26 1.35%

Basic Info

Investment Strategy
The investment seeks to replicate as closely as possible, before fees and expenses, the price and yield performance of the MVIS Global Low Carbon Energy Index. The fund normally invests at least 80% of its total assets in stocks of low carbon energy companies. Such companies may include small- and medium-capitalization companies and foreign issuers. “Low carbon energy companies” refers to companies primarily engaged in renewable energy, including renewable energy production, alternative fuels, electric vehicles, and related technologies and building materials (such as advanced batteries). It is non-diversified.
General
Security Type Exchange-Traded Fund
Equity Style Large Cap/Growth
Fixed Income Style --
Broad Asset Class Sector Equity
Broad Category Equity
Category Name Miscellaneous Sector
Category Index Morningstar US Market TR USD
Global Category Name Equity Miscellaneous
YCharts Categorization Other
YCharts Benchmark S&P 500 Total Return (^SPXTR)
Prospectus Objective Specialty - Natural Resources
Fund Owner Firm Name VanEck
Prospectus Benchmark Index
MVIS Global Low Carbon Energy TR USD 100.0%
Broad Asset Class Benchmark Index
^MSWNTR 100.0%
Manager Tenure
Peter Liao 15.84 yrs

Fundamentals

General
Distribution Yield Upgrade
Dividend Yield TTM (3-31-23) 1.20%
30-Day SEC Yield (3-27-23) Upgrade
7-Day SEC Yield --
Number of Holdings Upgrade
Stock
Weighted Average PE Ratio 22.01
Weighted Average Price to Sales Ratio Upgrade
Weighted Average Price to Book Ratio Upgrade
Weighted Median ROE Upgrade
Weighted Median ROA Upgrade
Forecasted Dividend Yield Upgrade
Forecasted PE Ratio Upgrade
Forecasted Price to Sales Ratio Upgrade
Forecasted Price to Book Ratio Upgrade
As of March 29, 2023

Growth Estimates

Forecasted 5 Yr Earnings Growth Upgrade
Forecasted Book Value Growth Upgrade
Forecasted Cash Flow Growth Upgrade
Forecasted Earnings Growth Upgrade
Forecasted Revenue Growth Upgrade
As of March 29, 2023

Fund Details

Key Dates
Inception Date 5/3/2007
Last Annual Report Date 12/31/2022
Last Prospectus Date 5/1/2022
Attributes
Index Fund Yes
Inverse Fund No
Leveraged Fund No
Fund of Funds No
Currency Hedged Fund No
Synthetic Replication Fund No
Has Dividend Investment Plan No
Socially Responsible Fund Yes

Top Portfolio Holders

0 of 0