

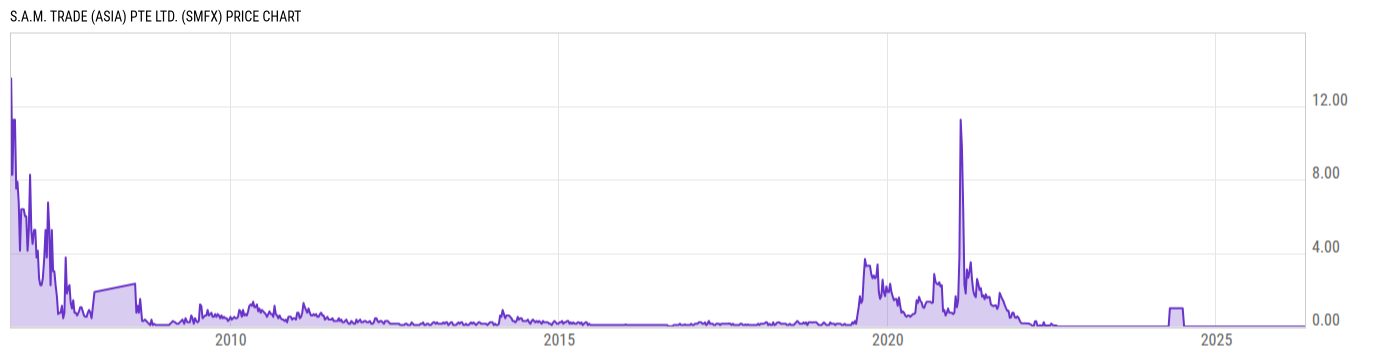
S.A.M. Trade (Asia) Pte Ltd. (SMFX)
0.0008
0.00 (0.00%)
USD |
OTCM |
May 08, 16:00
Price Chart
Key Stats
| Price and Performance | |
|---|---|
| Market Cap | 0.0001M |
| 52 Week High (Daily) | |
| 52 Week Low (Daily) | |
| All-Time High (Daily) | |
| Year to Date Total Returns (Daily) | |
| 1 Month Total Returns (Daily) | |
| 1 Year Total Returns (Daily) | 33.33% |
| Valuation | |
| PE Ratio | -- |
| PE Ratio (Forward) | |
| PS Ratio | -- |
| Price to Book Value | -- |
| EV to EBITDA | |
| Dividend | |
|---|---|
| Dividend | -- |
| Dividend Yield (Forward) | |
| Financials | |
| Revenue (5 Year Growth) | |
| Revenue (Quarterly YoY Growth) | |
| EPS Diluted (5 Year Growth) | |
| EPS Diluted (Quarterly YoY Growth) | |
| Debt to Equity Ratio | -- |
| Return on Equity | |
| Return on Assets | |
| Risk | |
| Beta (5Y) | |
| Max Drawdown (5Y) | 100.00% |
Profile
| S.A.M. Trade (Asia) Pte Ltd. operates as an investment holding company, which engages in the management of intellectual property, technology analytics, and the development of trading platforms. The company was founded by Nai De Goh on January 29, 2002 and is headquartered in Reno, NV. |
| URL | http://www.samtradefx.com |
| Investor Relations URL | N/A |
| HQ State/Province | Nevada |
| Sector | Information Technology |
| Industry | Software |
| Next Earnings Release | N/A |
| Last Earnings Release | N/A |
| Next Ex-Dividend Date | N/A |
| Last Ex-Dividend Date | N/A |