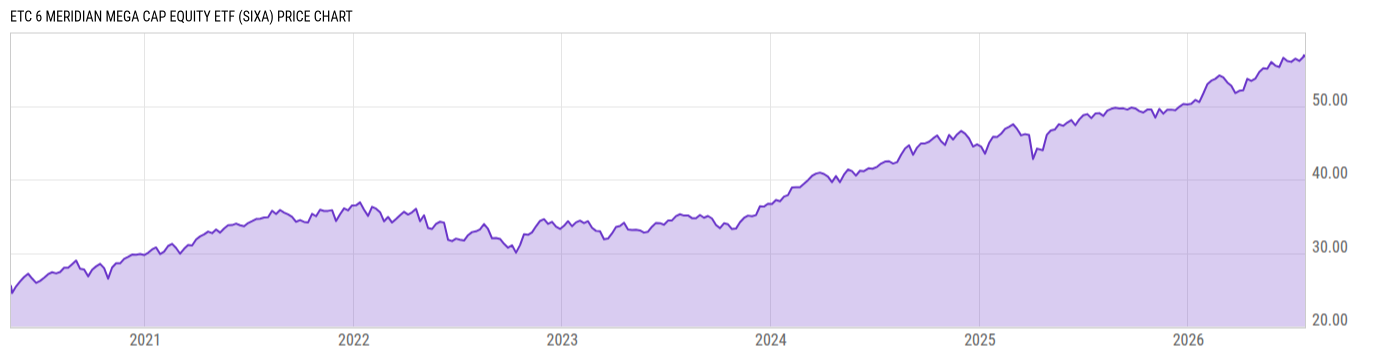
Key Stats

Expense Ratio Discount or Premium to NAV Total Assets Under Management 30-Day Average Daily Volume
0.80% -0.12% 169.85M 2771.13
Dividend Yield Turnover Ratio 1 Year Fund Level Flows Max Drawdown (All)
2.22% 160.0% 19.08M Upgrade

Basic Info

Investment Strategy
The investment seeks to provide capital appreciation. Under normal circumstances, the fund invests at least 80% of its net assets (plus the amount of any borrowings for investment purposes) in mega capitalization equity securities. The Sub-Adviser considers mega capitalization companies to be the largest 10% of stocks included in the Russell 3000 Index by market capitalization. The equity securities in which it invests are mainly common stocks. The fund is non-diversified.
General
Security Type Exchange-Traded Fund
Equity Style Large Cap/Value
Fixed Income Style --
Broad Asset Class US Equity
Broad Category Equity
Category Name Large Value
Category Index Russell 1000 Value TR USD
Global Category Name US Equity Large Cap Value
YCharts Categorization US Large Cap Value
YCharts Benchmark Russell 1000 Value Total Return (^RLVTR)
Prospectus Objective Growth
Fund Owner Firm Name Exchange Traded Concepts
Prospectus Benchmark Index
S&P 500 TR USD 100.0%
Broad Asset Class Benchmark Index
^SPXTR 100.0%
Manager Tenure
Ammie Weidner 2.81 yrs
Andrew Mies 2.81 yrs
Andrew Serowik 2.81 yrs
Gabriel Tan 1.91 yrs
Todd Alberico 1.91 yrs
Jason Mayers 0.91 yrs

Net Fund Flows Versus Category

View Net Fund Flows. Upgrade now.
1M
3M
6M
YTD
1Y
3Y
5Y
10Y
 
80.00B
60.00B
40.00B
20.00B
0
-20.00B
1 Month
% Rank: --
-- Category Low
-- Category High
1 Year
% Rank: 24
19.08M
-6.415B Category Low
13.81B Category High
3 Months
% Rank: --
-- Category Low
-- Category High
3 Years
% Rank: --
-- Category Low
-- Category High
6 Months
% Rank: --
-- Category Low
-- Category High
5 Years
% Rank: --
-- Category Low
-- Category High
YTD
% Rank: --
-- Category Low
-- Category High
10 Years
% Rank: --
-- Category Low
-- Category High
As of February 28, 2023

Performance Versus Category

 
20%
15%
10%
5%
0
View Category Returns. Upgrade now.
Name
1M
3M
YTD
1Y
3Y
5Y
10Y
15Y
Total Return (Price)
--
--
--
--
--
--
--
--
Total Return (NAV)
--
--
--
--
--
--
--
--
Category Rtn. (NAV)
--
--
--
--
--
--
--
--
% Rank in Cat (NAV)
--
--
--
--
--
--
--
--
As of March 24, 2023. Returns for periods of 1 year and above are annualized.

Annual Total Returns Versus Peers

Loading chart...
Name
2016
2017
2018
2019
2020
2021
2022
YTD
--
--
--
--
--
23.89%
-5.71%
-3.90%
11.96%
21.83%
-4.38%
31.49%
18.40%
28.71%
-18.11%
3.86%
8.92%
22.88%
-9.57%
23.94%
6.58%
27.31%
-9.64%
-0.88%
20.48%
16.29%
-5.86%
26.37%
-3.32%
33.41%
-0.44%
-5.55%
--
--
--
--
--
--
-9.14%
-0.72%
15.28%
18.16%
-7.87%
26.20%
9.97%
30.96%
-8.25%
-1.79%
As of March 24, 2023.

Fundamentals

General
Distribution Yield Upgrade
Dividend Yield TTM (3-24-23) 2.22%
30-Day SEC Yield (3-14-23) Upgrade
7-Day SEC Yield --
Number of Holdings Upgrade
Stock
Weighted Average PE Ratio 15.32
Weighted Average Price to Sales Ratio Upgrade
Weighted Average Price to Book Ratio Upgrade
Weighted Median ROE Upgrade
Weighted Median ROA Upgrade
Forecasted Dividend Yield Upgrade
Forecasted PE Ratio Upgrade
Forecasted Price to Sales Ratio Upgrade
Forecasted Price to Book Ratio Upgrade
As of March 23, 2023

Growth Estimates

Forecasted 5 Yr Earnings Growth Upgrade
Forecasted Book Value Growth Upgrade
Forecasted Cash Flow Growth Upgrade
Forecasted Earnings Growth Upgrade
Forecasted Revenue Growth Upgrade
As of March 23, 2023

Asset Allocation

As of March 23, 2023.
Type % Net % Long % Short
Cash 0.24% Upgrade Upgrade
Stock 99.76% Upgrade Upgrade
Bond 0.00% Upgrade Upgrade
Convertible 0.00% Upgrade Upgrade
Preferred 0.00% Upgrade Upgrade
Other 0.00% Upgrade Upgrade

Top 10 Holdings

Name % Weight Price % Change
Eli Lilly and Co 4.38% 336.13 1.05%
Merck & Co Inc 4.04% 104.80 0.55%
Verizon Communications Inc 4.03% 37.66 0.78%
Altria Group Inc 3.89% 43.97 1.17%
Philip Morris International Inc 3.83% 90.75 0.53%
ConocoPhillips 3.75% 95.43 -1.03%
McDonald's Corp 2.83% 271.33 0.63%
Qualcomm Inc 2.77% 124.76 0.49%
Walmart Inc 2.77% 141.80 0.82%
AbbVie Inc 2.76% 158.02 1.75%

News

Headline
Wire
Time (ET)
No Data Available

Basic Info

Investment Strategy
The investment seeks to provide capital appreciation. Under normal circumstances, the fund invests at least 80% of its net assets (plus the amount of any borrowings for investment purposes) in mega capitalization equity securities. The Sub-Adviser considers mega capitalization companies to be the largest 10% of stocks included in the Russell 3000 Index by market capitalization. The equity securities in which it invests are mainly common stocks. The fund is non-diversified.
General
Security Type Exchange-Traded Fund
Equity Style Large Cap/Value
Fixed Income Style --
Broad Asset Class US Equity
Broad Category Equity
Category Name Large Value
Category Index Russell 1000 Value TR USD
Global Category Name US Equity Large Cap Value
YCharts Categorization US Large Cap Value
YCharts Benchmark Russell 1000 Value Total Return (^RLVTR)
Prospectus Objective Growth
Fund Owner Firm Name Exchange Traded Concepts
Prospectus Benchmark Index
S&P 500 TR USD 100.0%
Broad Asset Class Benchmark Index
^SPXTR 100.0%
Manager Tenure
Ammie Weidner 2.81 yrs
Andrew Mies 2.81 yrs
Andrew Serowik 2.81 yrs
Gabriel Tan 1.91 yrs
Todd Alberico 1.91 yrs
Jason Mayers 0.91 yrs

Fundamentals

General
Distribution Yield Upgrade
Dividend Yield TTM (3-24-23) 2.22%
30-Day SEC Yield (3-14-23) Upgrade
7-Day SEC Yield --
Number of Holdings Upgrade
Stock
Weighted Average PE Ratio 15.32
Weighted Average Price to Sales Ratio Upgrade
Weighted Average Price to Book Ratio Upgrade
Weighted Median ROE Upgrade
Weighted Median ROA Upgrade
Forecasted Dividend Yield Upgrade
Forecasted PE Ratio Upgrade
Forecasted Price to Sales Ratio Upgrade
Forecasted Price to Book Ratio Upgrade
As of March 23, 2023

Growth Estimates

Forecasted 5 Yr Earnings Growth Upgrade
Forecasted Book Value Growth Upgrade
Forecasted Cash Flow Growth Upgrade
Forecasted Earnings Growth Upgrade
Forecasted Revenue Growth Upgrade
As of March 23, 2023

Fund Details

Key Dates
Inception Date 5/11/2020
Last Annual Report Date 11/30/2022
Last Prospectus Date 4/1/2022
Attributes
Index Fund No
Inverse Fund No
Leveraged Fund No
Fund of Funds No
Currency Hedged Fund No
Synthetic Replication Fund No
Has Dividend Investment Plan No
Socially Responsible Fund No

News

Headline
Wire
Time (ET)
No Data Available

Top Portfolio Holders

0 of 0