

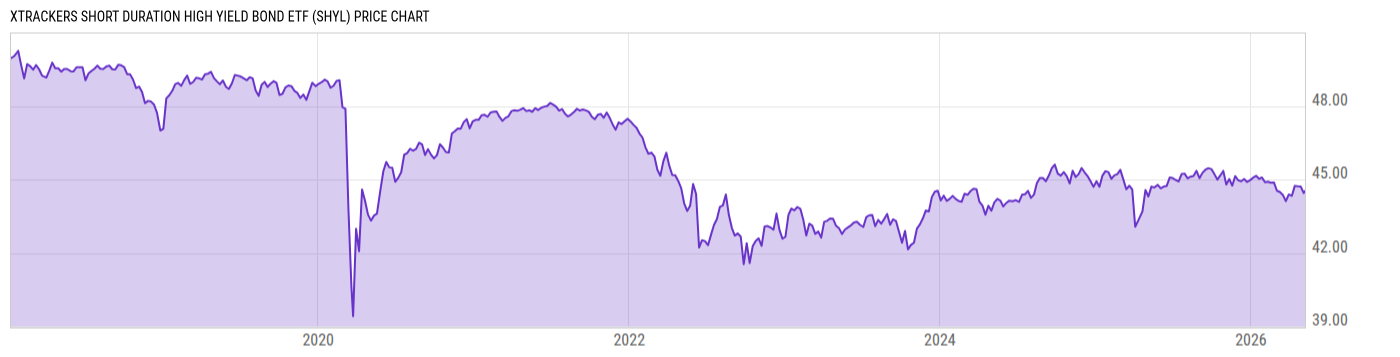
Xtrackers Short Duration High Yield Bond ETF (SHYL)
44.58
+0.06
(+0.12%)
USD |
NYSEARCA |
May 29, 16:00
44.58
0.00 (0.00%)
After-Hours: 20:00
Price Chart
Key Stats
| Net Expense Ratio | Discount or Premium to NAV | Total Assets Under Management | 30-Day Average Daily Volume |
|---|---|---|---|
| 0.20% | 0.03% | 265.14M | 29881.27 |
| Weighted Average Dividend Yield | Turnover Ratio (Generic) | 1 Year Fund Level Flows | Max Drawdown (Since Inception) |
| -- | 48.00% | 94.58M |
Basic Info
| Investment Strategy | |
| The Fund seeks investment results that correspond generally to the performance, before fees and expenses, of the Solactive USD High Yield Corporates Total Market 0-5 Year Index. The Index is designed to track the performance of short-term publicly issued U.S. dollar-denominated below investment grade corporate debt. |
| General | |
| Security Type | Exchange-Traded Fund |
| Equity Style | -- |
| Broad Asset Class | Taxable Bond |
| Broad Category | Fixed Income |
| Global Peer Group | Bond USD High Yield |
| Peer Group | Short High Yield Funds |
| Global Macro | Bond High Yield |
| US Macro | High Yield Funds |
| YCharts Categorization | -- |
| YCharts Benchmark | -- |
| Prospectus Objective | Short High Yield Funds |
| Fund Owner Firm Name | DWS |
| Broad Asset Class Benchmark Index | |
| ^BBUSATR | 100.0% |
Performance Versus Peer Group
Annual Total Returns Versus Peers
As of May 31, 2026.
Asset Allocation
As of March 31, 2026.
| Type | % Net |
|---|---|
| Cash | 2.86% |
| Stock | 0.00% |
| Bond | 97.14% |
| Convertible | 0.00% |
| Preferred | 0.00% |
| Other | -0.00% |
Basic Info
| Investment Strategy | |
| The Fund seeks investment results that correspond generally to the performance, before fees and expenses, of the Solactive USD High Yield Corporates Total Market 0-5 Year Index. The Index is designed to track the performance of short-term publicly issued U.S. dollar-denominated below investment grade corporate debt. |
| General | |
| Security Type | Exchange-Traded Fund |
| Equity Style | -- |
| Broad Asset Class | Taxable Bond |
| Broad Category | Fixed Income |
| Global Peer Group | Bond USD High Yield |
| Peer Group | Short High Yield Funds |
| Global Macro | Bond High Yield |
| US Macro | High Yield Funds |
| YCharts Categorization | -- |
| YCharts Benchmark | -- |
| Prospectus Objective | Short High Yield Funds |
| Fund Owner Firm Name | DWS |
| Broad Asset Class Benchmark Index | |
| ^BBUSATR | 100.0% |