

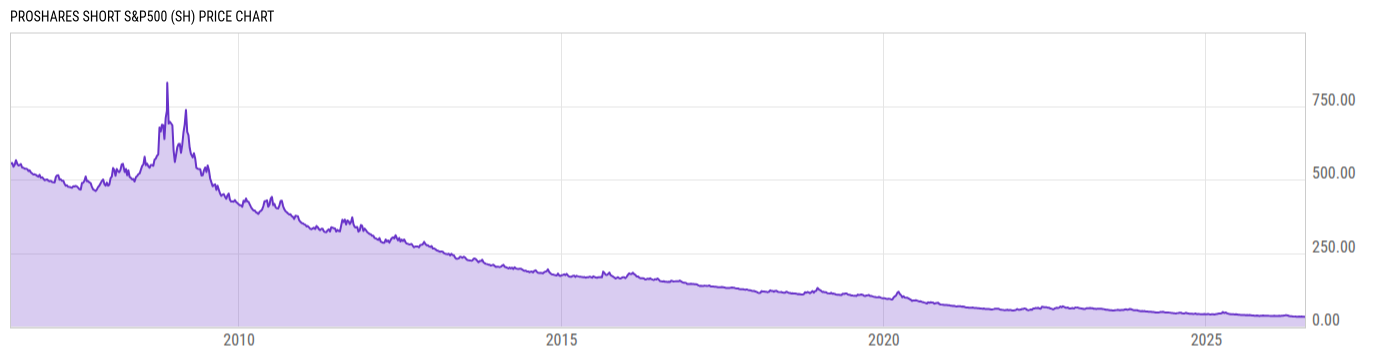
ProShares Short S&P500 (SH)
32.96
+0.23
(+0.70%)
USD |
NYSEARCA |
Jul 13, 16:00
33.05
+0.09
(+0.27%)
After-Hours: 20:00
Price Chart
Key Stats
| Net Expense Ratio | Discount or Premium to NAV | Total Assets Under Management | 30-Day Average Daily Volume |
|---|---|---|---|
| 0.89% | 0.03% | 869.15M | 9.803M |
| Weighted Average Dividend Yield | Turnover Ratio (Generic) | 1 Year Fund Level Flows | Max Drawdown (Since Inception) |
| -- | -- | 85.08M |
Basic Info
| Investment Strategy | |
| The Fund seeks daily investment results, before fees and expenses, that correspond to the inverse (opposite) of the daily performance of the S&P 500 Index. |
| General | |
| Security Type | Exchange-Traded Fund |
| Equity Style | -- |
| Broad Asset Class | Alternative |
| Broad Category | Alternative Strategies |
| Global Peer Group | Alternative Dedicated Short Bias |
| Peer Group | Dedicated Short Bias Funds |
| Global Macro | Liquid Alternatives |
| US Macro | Alternative Equity Funds |
| YCharts Categorization | -- |
| YCharts Benchmark | -- |
| Prospectus Objective | Dedicated Short Bias Funds |
| Fund Owner Firm Name | ProShares |
| Broad Asset Class Benchmark Index | |
| ^MSACWINTR | 100.0% |
Performance Versus Peer Group
Annual Total Returns Versus Peers
As of July 14, 2026.
Asset Allocation
As of June 30, 2026.
| Type | % Net |
|---|---|
| Cash | 6.08% |
| Stock | 0.00% |
| Bond | 113.7% |
| Convertible | 0.00% |
| Preferred | 0.00% |
| Other | -19.73% |
Basic Info
| Investment Strategy | |
| The Fund seeks daily investment results, before fees and expenses, that correspond to the inverse (opposite) of the daily performance of the S&P 500 Index. |
| General | |
| Security Type | Exchange-Traded Fund |
| Equity Style | -- |
| Broad Asset Class | Alternative |
| Broad Category | Alternative Strategies |
| Global Peer Group | Alternative Dedicated Short Bias |
| Peer Group | Dedicated Short Bias Funds |
| Global Macro | Liquid Alternatives |
| US Macro | Alternative Equity Funds |
| YCharts Categorization | -- |
| YCharts Benchmark | -- |
| Prospectus Objective | Dedicated Short Bias Funds |
| Fund Owner Firm Name | ProShares |
| Broad Asset Class Benchmark Index | |
| ^MSACWINTR | 100.0% |