

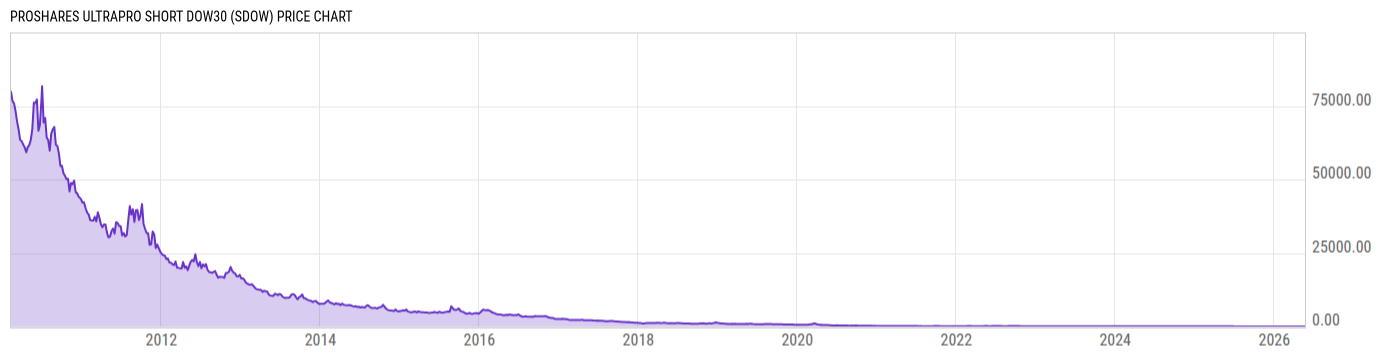
ProShares UltraPro Short Dow30 (SDOW)
29.04
+0.52
(+1.84%)
USD |
NYSEARCA |
May 19, 16:00
29.10
+0.06
(+0.22%)
After-Hours: 17:02
Price Chart
Key Stats
| Net Expense Ratio | Discount or Premium to NAV | Total Assets Under Management | 30-Day Average Daily Volume |
|---|---|---|---|
| 0.95% | -0.11% | 185.44M | 5.220M |
| Weighted Average Dividend Yield | Turnover Ratio (Generic) | 1 Year Fund Level Flows | Max Drawdown (Since Inception) |
| -- | -- | 89.40M |
Basic Info
| Investment Strategy | |
| The Fund seeks daily investment results that correspond to triple the inverse of the daily performance of the Dow Jones Industrial Average. The Fund invests in derivatives that the Advisors believe should have similar daily performance characteristics as three times the inverse of the daily performance of the Index. |
| General | |
| Security Type | Exchange-Traded Fund |
| Equity Style | -- |
| Broad Asset Class | Alternative |
| Broad Category | Alternative Strategies |
| Global Peer Group | Alternative Dedicated Short Bias |
| Peer Group | Dedicated Short Bias Funds |
| Global Macro | Liquid Alternatives |
| US Macro | Alternative Equity Funds |
| YCharts Categorization | -- |
| YCharts Benchmark | -- |
| Prospectus Objective | Dedicated Short Bias Funds |
| Fund Owner Firm Name | ProShares |
| Broad Asset Class Benchmark Index | |
| ^MSACWINTR | 100.0% |
Performance Versus Peer Group
Annual Total Returns Versus Peers
As of May 19, 2026.
Asset Allocation
As of April 30, 2026.
| Type | % Net |
|---|---|
| Cash | 22.22% |
| Stock | 0.00% |
| Bond | 108.4% |
| Convertible | 0.00% |
| Preferred | 0.00% |
| Other | -30.60% |
Basic Info
| Investment Strategy | |
| The Fund seeks daily investment results that correspond to triple the inverse of the daily performance of the Dow Jones Industrial Average. The Fund invests in derivatives that the Advisors believe should have similar daily performance characteristics as three times the inverse of the daily performance of the Index. |
| General | |
| Security Type | Exchange-Traded Fund |
| Equity Style | -- |
| Broad Asset Class | Alternative |
| Broad Category | Alternative Strategies |
| Global Peer Group | Alternative Dedicated Short Bias |
| Peer Group | Dedicated Short Bias Funds |
| Global Macro | Liquid Alternatives |
| US Macro | Alternative Equity Funds |
| YCharts Categorization | -- |
| YCharts Benchmark | -- |
| Prospectus Objective | Dedicated Short Bias Funds |
| Fund Owner Firm Name | ProShares |
| Broad Asset Class Benchmark Index | |
| ^MSACWINTR | 100.0% |