

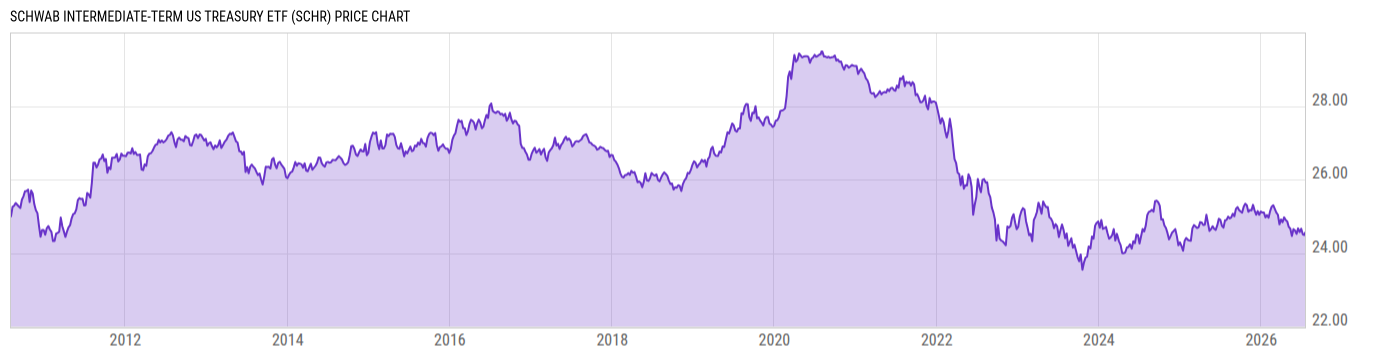
Schwab Intermediate-Term US Treasury ETF (SCHR)
24.55
+0.02
(+0.08%)
USD |
NYSEARCA |
Jul 17, 16:00
24.54
0.00 (0.00%)
Pre-Market: 20:00
Price Chart
Key Stats
| Net Expense Ratio | Discount or Premium to NAV | Total Assets Under Management | 30-Day Average Daily Volume |
|---|---|---|---|
| 0.03% | 0.02% | 13.35B | 3.137M |
| Weighted Average Dividend Yield | Turnover Ratio (Generic) | 1 Year Fund Level Flows | Max Drawdown (Since Inception) |
| -- | 42.00% | 1.975B |
Basic Info
| Investment Strategy | |
| The Fund seeks investment results that track the price and yield performance of the Barclays Capital U.S. 3-10 Year Treasury Bond Index. The Fund invests in U.S Treasury securities that have a remaining maturity of three to ten years, are rated investment grade, and have $250 million or more of outstanding face value. |
| General | |
| Security Type | Exchange-Traded Fund |
| Equity Style | -- |
| Broad Asset Class | Taxable Bond |
| Broad Category | Fixed Income |
| Global Peer Group | Bond USD Government |
| Peer Group | General U.S. Treasury Funds |
| Global Macro | Bond Government |
| US Macro | U.S. Government & Treasury Fixed Income Funds |
| YCharts Categorization | -- |
| YCharts Benchmark | -- |
| Prospectus Objective | General U.S. Treasury Funds |
| Fund Owner Firm Name | Charles Schwab |
| Broad Asset Class Benchmark Index | |
| ^BBUSATR | 100.0% |
Performance Versus Peer Group
Annual Total Returns Versus Peers
As of July 18, 2026.
Asset Allocation
As of June 30, 2026.
| Type | % Net |
|---|---|
| Cash | 0.11% |
| Stock | 0.00% |
| Bond | 99.06% |
| Convertible | 0.00% |
| Preferred | 0.00% |
| Other | 0.83% |
Basic Info
| Investment Strategy | |
| The Fund seeks investment results that track the price and yield performance of the Barclays Capital U.S. 3-10 Year Treasury Bond Index. The Fund invests in U.S Treasury securities that have a remaining maturity of three to ten years, are rated investment grade, and have $250 million or more of outstanding face value. |
| General | |
| Security Type | Exchange-Traded Fund |
| Equity Style | -- |
| Broad Asset Class | Taxable Bond |
| Broad Category | Fixed Income |
| Global Peer Group | Bond USD Government |
| Peer Group | General U.S. Treasury Funds |
| Global Macro | Bond Government |
| US Macro | U.S. Government & Treasury Fixed Income Funds |
| YCharts Categorization | -- |
| YCharts Benchmark | -- |
| Prospectus Objective | General U.S. Treasury Funds |
| Fund Owner Firm Name | Charles Schwab |
| Broad Asset Class Benchmark Index | |
| ^BBUSATR | 100.0% |