

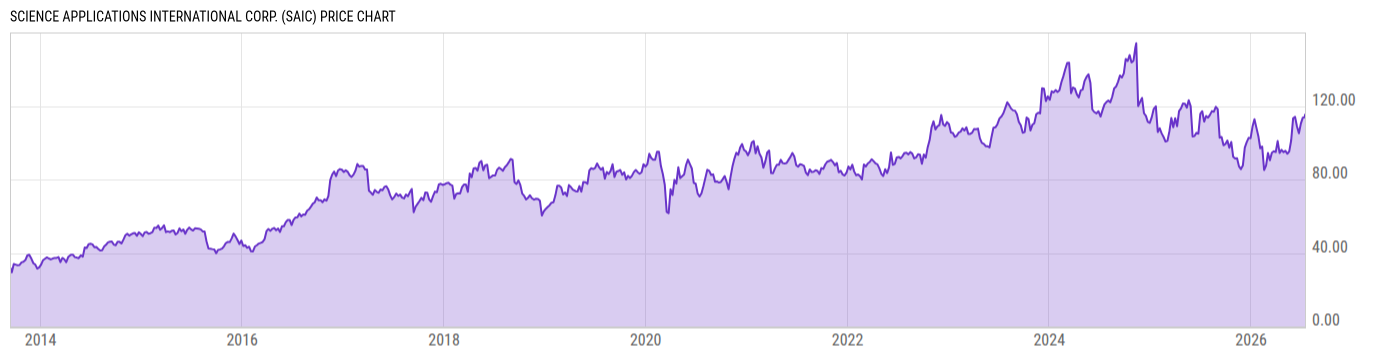
Science Applications International Corp. (SAIC)
115.28
+1.36
(+1.19%)
USD |
NASDAQ |
Jul 15, 16:00
115.20
-0.08
(-0.07%)
After-Hours: 20:00
Price Chart
Key Stats
| Price and Performance | |
|---|---|
| Market Cap | 4.957B |
| 52 Week High (Daily) | |
| 52 Week Low (Daily) | |
| All-Time High (Daily) | |
| Year to Date Total Returns (Daily) | |
| 1 Month Total Returns (Daily) | |
| 1 Year Total Returns (Daily) | 4.91% |
| Valuation | |
| PE Ratio | 12.97 |
| PE Ratio (Forward) | |
| PS Ratio | 0.7206 |
| Price to Book Value | 3.484 |
| EV to EBITDA | |
| Dividend | |
|---|---|
| Dividend | 0.37 |
| Dividend Yield (Forward) | |
| Financials | |
| Revenue (5 Year Growth) | |
| Revenue (Quarterly YoY Growth) | |
| EPS Diluted (5 Year Growth) | |
| EPS Diluted (Quarterly YoY Growth) | |
| Debt to Equity Ratio | 1.880 |
| Return on Equity | |
| Return on Assets | |
| Risk | |
| Beta (5Y) | |
| Max Drawdown (5Y) | 45.74% |
Profile
| Science Applications International Corp. is a provider of technical, engineering and enterprise information technology (IT) services. Its offerings include engineering, systems integration and information technology offerings for large, complex government projects and offer a broad range of services with a targeted emphasis on higher end, differentiated technology services, and end-to-end services spanning the entire spectrum of its customers IT infrastructure. The firm’s key customers include the Department of Defense (DoD), National Aeronautics and Space Administration (NASA), U.S. Department of State, Department of Justice, Department of Homeland Security and several sensitive intelligence community agencies. The company was founded by John Robert Beyster in 1969 and is headquartered in Reston, VA. |
| URL | http://www.saic.com |
| Investor Relations URL | https://investors.saic.com |
| HQ State/Province | Virginia |
| Sector | Industrials |
| Industry | Professional Services |
| Equity Style | Small Cap Core |
| Next Earnings Release | Sep. 03, 2026 (est.) |
| Last Earnings Release | Jun. 01, 2026 |
| Next Ex-Dividend Date | N/A |
| Last Ex-Dividend Date | Jul. 10, 2026 |