

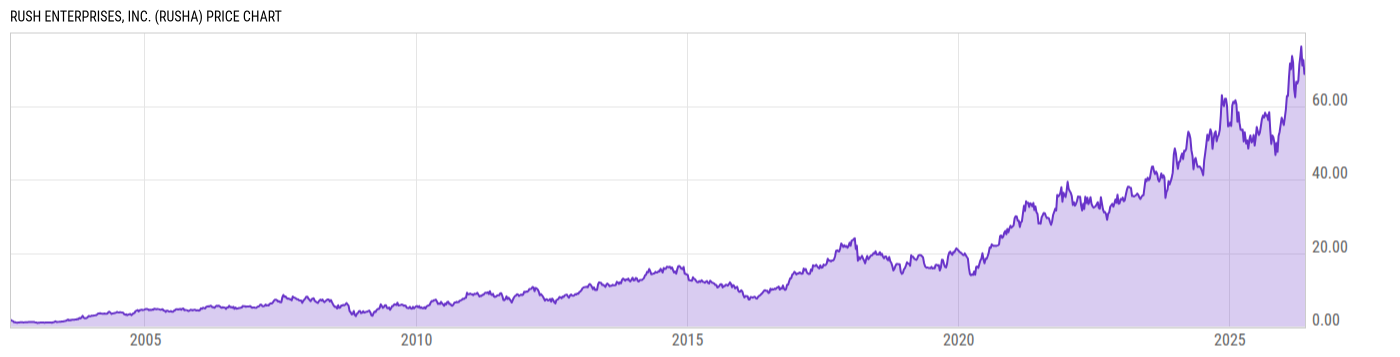
Rush Enterprises, Inc. (RUSHA)
68.48
+1.21
(+1.80%)
USD |
NASDAQ |
Jun 09, 14:08
Price Chart
Key Stats
| Price and Performance | |
|---|---|
| Market Cap | 5.312B |
| 52 Week High (Daily) | |
| 52 Week Low (Daily) | |
| All-Time High (Daily) | |
| Year to Date Total Returns (Daily) | |
| 1 Month Total Returns (Daily) | |
| 1 Year Total Returns (Daily) | 34.55% |
| Valuation | |
| PE Ratio | 20.71 |
| PE Ratio (Forward) | |
| PS Ratio | 0.7546 |
| Price to Book Value | 2.341 |
| EV to EBITDA | |
| Dividend | |
|---|---|
| Dividend | 0.19 |
| Dividend Yield (Forward) | |
| Financials | |
| Revenue (5 Year Growth) | |
| Revenue (Quarterly YoY Growth) | |
| EPS Diluted (5 Year Growth) | |
| EPS Diluted (Quarterly YoY Growth) | |
| Debt to Equity Ratio | 0.6328 |
| Return on Equity | |
| Return on Assets | |
| Risk | |
| Beta (5Y) | |
| Max Drawdown (5Y) | 27.28% |
Profile
| Rush Enterprises, Inc. engages in the business of retailing commercial vehicles. It operates under the Truck and All Other segments. The Truck segment includes an operating network of commercial vehicle dealerships that provide an integrated one-stop source for the commercial vehicle needs of its customers, including retail sales of new and used commercial vehicles, aftermarket parts, service, and collision center facilities, and financial services, including the financing of new and used commercial vehicle purchases, insurance products, and truck leasing and rentals. The All Other segment focuses on the retail tire company, an insurance agency, and a guest ranch operation. The company was founded by W. Marvin Rush in 1965 and is headquartered in New Braunfels, TX. |
| URL | http://www.rushenterprises.com |
| Investor Relations URL | https://investor.rushenterprises.com/ |
| HQ State/Province | Texas |
| Sector | Industrials |
| Industry | Trading Companies & Distributors |
| Next Earnings Release | Jul. 29, 2026 (est.) |
| Last Earnings Release | Apr. 28, 2026 |
| Next Ex-Dividend Date | N/A |
| Last Ex-Dividend Date | May. 12, 2026 |