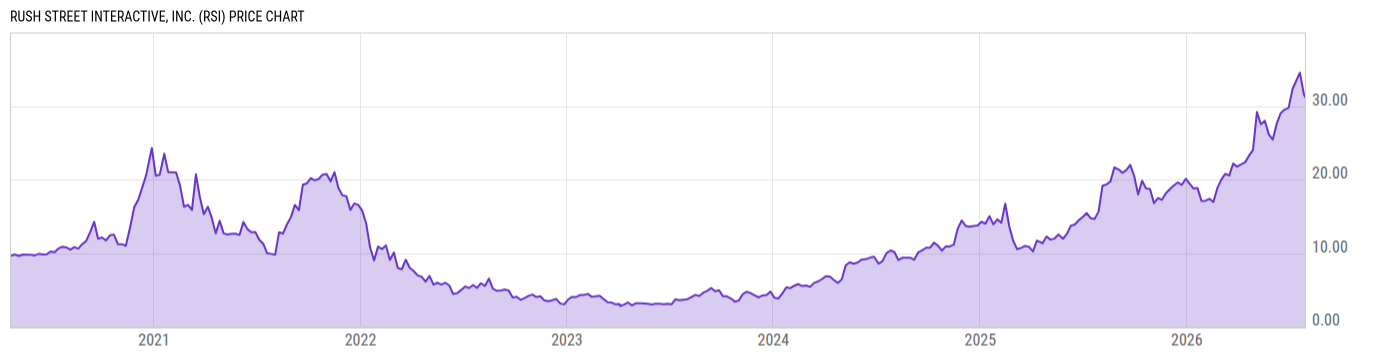
Rush Street Interactive Inc (RSI)
3.13
-0.10
(-3.10%)
USD |
NYSE |
Mar 27, 16:00
3.11
-0.02
(-0.64%)
Pre-Market: 20:00
Key Stats
Price and Performance | |
---|---|
Market Cap | 203.81M |
52 Week High (Daily) | Upgrade |
52 Week Low (Daily) | Upgrade |
All-Time High (Daily) | Upgrade |
Year to Date Total Returns (Daily) | Upgrade |
1 Month Total Returns (Daily) | Upgrade |
1 Year Total Returns (Daily) | -60.53% |
Valuation | |
PE Ratio | -- |
PE Ratio (Forward) | Upgrade |
PS Ratio | 0.3358 |
Price to Book Value | 3.636 |
EV to EBITDA | Upgrade |
Dividend | |
---|---|
Dividend | -- |
Dividend Yield (Forward) | Upgrade |
Financials | |
Revenue (5 Year Growth) | Upgrade |
Revenue (Quarterly YoY Growth) | Upgrade |
EPS Diluted (5 Year Growth) | Upgrade |
EPS Diluted (Quarterly YoY Growth) | Upgrade |
Debt to Equity Ratio | 0.00 |
Return on Equity | Upgrade |
Return on Assets | Upgrade |
Risk | |
Beta (5Y) | Upgrade |
Max Drawdown (5Y) | -- |
News
Headline
Wire
Time (ET)
MT Newswires
03/27 17:32
Yahoo
03/27 16:15
MT Newswires
03/07 10:16
Wells Fargo Trims Price Target on Rush Street Interactive to $6 From $8, Maintains Overweight Rating
MT Newswires
03/02 10:56
MT Newswires
03/01 16:18
Globe Newswire
02/09 08:30
Events
DATE | TIME | TYPE | PERIOD | REPORTED EPS |
ESTIMATED EPS |
SURPRISE | |
05/04/2023* | 17:00 EST | Earnings Call | Q1 2023 | -- | -- | -- | |
05/04/2023* | -- | Results | Q1 2023 | -- | -- | -- | |
03/01/2023 | 17:00 EST | Earnings Call | Q4 2022 | -- | -- | -- | |
03/01/2023 | -- | Results | Q4 2022 | -0.11 | -0.11 | -0.09% | |
11/02/2022 | 17:00 EST | Earnings Call | Q3 2022 | -- | -- | -- | |
11/02/2022 | -- | Results | Q3 2022 | -0.08 | -0.11 | 25.51% | |
08/04/2022 | 17:00 EST | Earnings Call | Q2 2022 | -- | -- | -- | |
08/04/2022 | -- | Results | Q2 2022 | -0.11 | -0.18 | 39.72% |
*Estimated Date/Time
Earnings
Profile
Edit
Rush Street Interactive Inc is an online gaming and entertainment company that focuses primarily on online casinos and online sports betting in the U.S. and Latin American markets. It provides customers with an array of gaming offerings such as real-money online casinos, online sports betting, and retail sports betting, as well as social gaming, which involves free-to-play games that use virtual credits that can be earned or purchased. The company generates revenue by offering online casinos, online sports betting, and social gaming directly to the end customer through its websites or apps. The company generates revenue through business-to-consumer (B2C) and business-to-business (B2B) models. |
URL | https://www.rushstreetinteractive.com |
Investor Relations URL | N/A |
HQ State/Province | Illinois |
Sector | Consumer Cyclical |
Industry | Gambling |
Equity Style | Small Cap/Growth |
Next Earnings Release | May. 04, 2023 (est.) |
Last Earnings Release | Mar. 01, 2023 |
Next Ex-Dividend Date | N/A |
Last Ex-Dividend Date | N/A |
Analyst Coverage
Consensus Rating
|
|
Analyst Recommendation
|
Source: S&P Global
Dividends
Dividend Per Share (TTM) | -- |
2017
2018
2019
2020
2021
6.00%
4.00%
2.00%
|
|
Yield to Market | 0.00 |
Yield to Sector | 0.00 |
Yield to Industry | 0.00 |
Last Dividend Amt. | -- |
Dividend Frequency | -- |
Last Ex-Dividend Date | -- |
Yield (TTM) | 0.00% |
Forward Yield | -- |
Payout Ratio | 0.00% |
Cash Payout Ratio | 0.00% |
Consistent Payer (5Y) | No |
Consistent Growth (5Y) | No |
Risk
Total Returns Comparison
Annual Total Returns Versus Peers
As of March 27, 2023.
Fundamentals
Revenue (TTM) | 592.21M |
Total Expenses (TTM) | 717.01M |
Net Income (TTM) | -38.63M |
Total Assets (Quarterly) | 350.35M |
Total Liabilities (Quarterly) | 159.47M |
Shareholders Equity (Quarterly) | 56.04M |
Cash from Operations (TTM) | -60.32M |
Cash from Investing (TTM) | -28.99M |
Cash from Financing (TTM) | -1.216M |
Ratings
Profile
Edit
Rush Street Interactive Inc is an online gaming and entertainment company that focuses primarily on online casinos and online sports betting in the U.S. and Latin American markets. It provides customers with an array of gaming offerings such as real-money online casinos, online sports betting, and retail sports betting, as well as social gaming, which involves free-to-play games that use virtual credits that can be earned or purchased. The company generates revenue by offering online casinos, online sports betting, and social gaming directly to the end customer through its websites or apps. The company generates revenue through business-to-consumer (B2C) and business-to-business (B2B) models. |
URL | https://www.rushstreetinteractive.com |
Investor Relations URL | N/A |
HQ State/Province | Illinois |
Sector | Consumer Cyclical |
Industry | Gambling |
Equity Style | Small Cap/Growth |
Next Earnings Release | May. 04, 2023 (est.) |
Last Earnings Release | Mar. 01, 2023 |
Next Ex-Dividend Date | N/A |
Last Ex-Dividend Date | N/A |
Ownership
Insider Ownership Percentage | Upgrade |
Jul '20
Nov '20
Mar '21
80.00%
40.00%
10.00%
Analyst Coverage
Consensus Rating
|
|
Analyst Recommendation
|
Source: S&P Global
Top Fund Holders
Symbol | Dollars Invested | % Weight |
---|---|---|
BETZ | 2.430M USD | 1.94% |
Other Resources
Whale Wisdom | 13F Filings |
Seeking Alpha | Call Transcripts |
Nasdaq | Insider Trading |
Nasdaq | Institutional Ownership |
Nasdaq | Option Chain |
SEC | SEC Filings |
RSI Tweets |