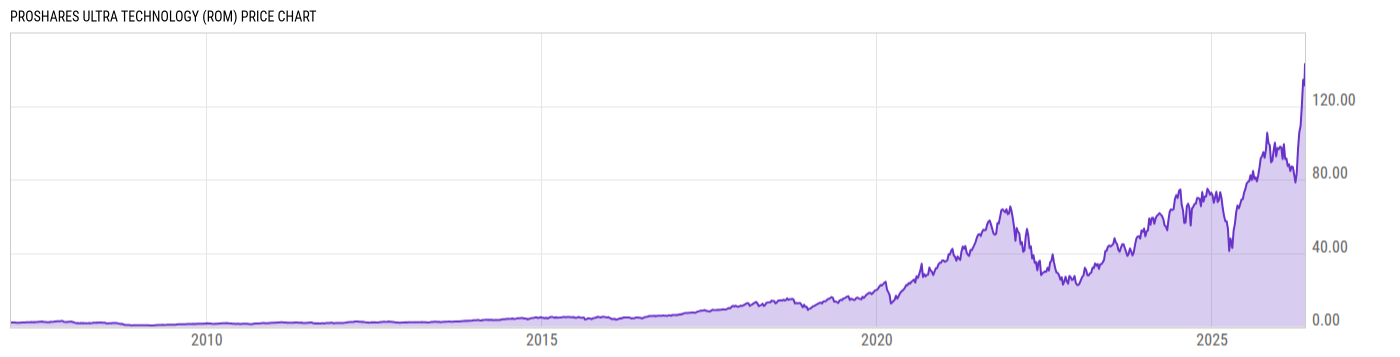
Key Stats

Expense Ratio Discount or Premium to NAV Total Assets Under Management 30-Day Average Daily Volume
0.96% 0.05% 396.23M 118515.8
Dividend Yield Turnover Ratio 1 Year Fund Level Flows Max Drawdown (All)
0% 41.00% -130.89M Upgrade

Basic Info

Investment Strategy
The investment seeks daily investment results that correspond to two times (2x) the daily performance of the S&P Technology Select Sector Index. The fund invests in financial instruments that ProShare Advisors believes, in combination, should produce daily returns consistent with the fund's investment objective. The index includes equity securities of companies from the following GICS industries: IT services; software; communications equipment; technology, hardware, storage & peripherals; electronic equipment, instruments, & components; and semiconductors & semiconductor equipment. The fund is non-diversified.
General
Security Type Exchange-Traded Fund
Equity Style Large Cap/Growth
Fixed Income Style --
Broad Asset Class Miscellaneous
Broad Category Miscellaneous
Category Name Trading--Leveraged Equity
Category Index S&P 500 TR USD
Global Category Name Trading Tools
YCharts Categorization Other
YCharts Benchmark S&P 500 Total Return (^SPXTR)
Prospectus Objective Specialty - Technology
Fund Owner Firm Name ProShares
Prospectus Benchmark Index
S&P Technology Select Sector TR USD 200.0%
Broad Asset Class Benchmark Index
^SPXTR 100.0%
Manager Tenure
Michael Neches 9.42 yrs
Tarak Davé 4.84 yrs

Net Fund Flows Versus Category

View Net Fund Flows. Upgrade now.
1M
3M
6M
YTD
1Y
3Y
5Y
10Y
 
80.00B
60.00B
40.00B
20.00B
0
-20.00B
1 Month
% Rank: --
-- Category Low
-- Category High
1 Year
% Rank: 98
-130.89M
-474.20M Category Low
4.729B Category High
3 Months
% Rank: --
-- Category Low
-- Category High
3 Years
% Rank: --
-- Category Low
-- Category High
6 Months
% Rank: --
-- Category Low
-- Category High
5 Years
% Rank: --
-- Category Low
-- Category High
YTD
% Rank: --
-- Category Low
-- Category High
10 Years
% Rank: --
-- Category Low
-- Category High
As of February 28, 2023

Performance Versus Category

 
20%
15%
10%
5%
0
View Category Returns. Upgrade now.
Name
1M
3M
YTD
1Y
3Y
5Y
10Y
15Y
Total Return (Price)
--
--
--
--
--
--
--
--
Total Return (NAV)
--
--
--
--
--
--
--
--
Category Rtn. (NAV)
--
--
--
--
--
--
--
--
% Rank in Cat (NAV)
--
--
--
--
--
--
--
--
As of March 24, 2023. Returns for periods of 1 year and above are annualized.

Annual Total Returns Versus Peers

Loading chart...
Name
2016
2017
2018
2019
2020
2021
2022
YTD
23.49%
81.11%
-9.91%
102.1%
80.42%
77.75%
-63.86%
41.50%
11.96%
21.83%
-4.38%
31.49%
18.40%
28.71%
-18.11%
3.86%
37.08%
124.8%
-24.02%
185.6%
69.37%
112.8%
-74.32%
52.98%
-43.39%
-60.81%
-19.14%
-73.77%
-87.78%
-67.92%
45.05%
-41.26%
-29.55%
-49.12%
-9.98%
-56.82%
-71.35%
-53.61%
64.96%
-33.32%
57.18%
81.72%
-26.92%
110.4%
68.18%
104.3%
-68.56%
62.91%
As of March 24, 2023.

Fundamentals

General
Distribution Yield Upgrade
Dividend Yield TTM (3-27-23) 0%
30-Day SEC Yield --
7-Day SEC Yield --
Number of Holdings Upgrade
Stock
Weighted Average PE Ratio --
Weighted Average Price to Sales Ratio --
Weighted Average Price to Book Ratio --
Weighted Median ROE --
Weighted Median ROA --
Forecasted Dividend Yield Upgrade
Forecasted PE Ratio Upgrade
Forecasted Price to Sales Ratio Upgrade
Forecasted Price to Book Ratio Upgrade
As of July 31, 2022

Growth Estimates

Forecasted 5 Yr Earnings Growth Upgrade
Forecasted Book Value Growth Upgrade
Forecasted Cash Flow Growth Upgrade
Forecasted Earnings Growth Upgrade
Forecasted Revenue Growth Upgrade
As of July 31, 2022

Asset Allocation

As of July 31, 2022.
Type % Net % Long % Short
Cash -122.8% Upgrade Upgrade
Stock 199.9% Upgrade Upgrade
Bond 0.00% Upgrade Upgrade
Convertible 0.00% Upgrade Upgrade
Preferred 0.00% Upgrade Upgrade
Other 22.93% Upgrade Upgrade

Top 10 Holdings

Name % Weight Price % Change
Dj U.S. Technology Index Swap Societe Generale
36.84% -- --
Dj U.S. Technology Index Swap Bnp Paribas
36.05% -- --
Dj U.S. Technology Index Swap Citibank Na
20.98% -- --
Apple Inc 17.62% 160.61 0.22%
Microsoft Corp 14.81% 280.78 0.07%
Dj U.S. Technology Index Swap Jp Morgan Securities
10.22% -- --
Dj U.S. Technology Index Swap Bank Of America Na
5.66% -- --
Dj U.S. Technology Index Swap Credit Suisse International
5.58% -- --
Alphabet Inc Class A 4.94% 104.60 -0.80%
Alphabet Inc Class C 4.54% 105.20 -0.81%

Basic Info

Investment Strategy
The investment seeks daily investment results that correspond to two times (2x) the daily performance of the S&P Technology Select Sector Index. The fund invests in financial instruments that ProShare Advisors believes, in combination, should produce daily returns consistent with the fund's investment objective. The index includes equity securities of companies from the following GICS industries: IT services; software; communications equipment; technology, hardware, storage & peripherals; electronic equipment, instruments, & components; and semiconductors & semiconductor equipment. The fund is non-diversified.
General
Security Type Exchange-Traded Fund
Equity Style Large Cap/Growth
Fixed Income Style --
Broad Asset Class Miscellaneous
Broad Category Miscellaneous
Category Name Trading--Leveraged Equity
Category Index S&P 500 TR USD
Global Category Name Trading Tools
YCharts Categorization Other
YCharts Benchmark S&P 500 Total Return (^SPXTR)
Prospectus Objective Specialty - Technology
Fund Owner Firm Name ProShares
Prospectus Benchmark Index
S&P Technology Select Sector TR USD 200.0%
Broad Asset Class Benchmark Index
^SPXTR 100.0%
Manager Tenure
Michael Neches 9.42 yrs
Tarak Davé 4.84 yrs

Fundamentals

General
Distribution Yield Upgrade
Dividend Yield TTM (3-27-23) 0%
30-Day SEC Yield --
7-Day SEC Yield --
Number of Holdings Upgrade
Stock
Weighted Average PE Ratio --
Weighted Average Price to Sales Ratio --
Weighted Average Price to Book Ratio --
Weighted Median ROE --
Weighted Median ROA --
Forecasted Dividend Yield Upgrade
Forecasted PE Ratio Upgrade
Forecasted Price to Sales Ratio Upgrade
Forecasted Price to Book Ratio Upgrade
As of July 31, 2022

Growth Estimates

Forecasted 5 Yr Earnings Growth Upgrade
Forecasted Book Value Growth Upgrade
Forecasted Cash Flow Growth Upgrade
Forecasted Earnings Growth Upgrade
Forecasted Revenue Growth Upgrade
As of July 31, 2022

Fund Details

Key Dates
Inception Date 1/30/2007
Last Annual Report Date 5/31/2022
Last Prospectus Date 10/1/2022
Attributes
Index Fund Yes
Inverse Fund No
Leveraged Fund Yes
Fund of Funds No
Currency Hedged Fund No
Synthetic Replication Fund No
Has Dividend Investment Plan No
Socially Responsible Fund No

Top Portfolio Holders

0 of 0