

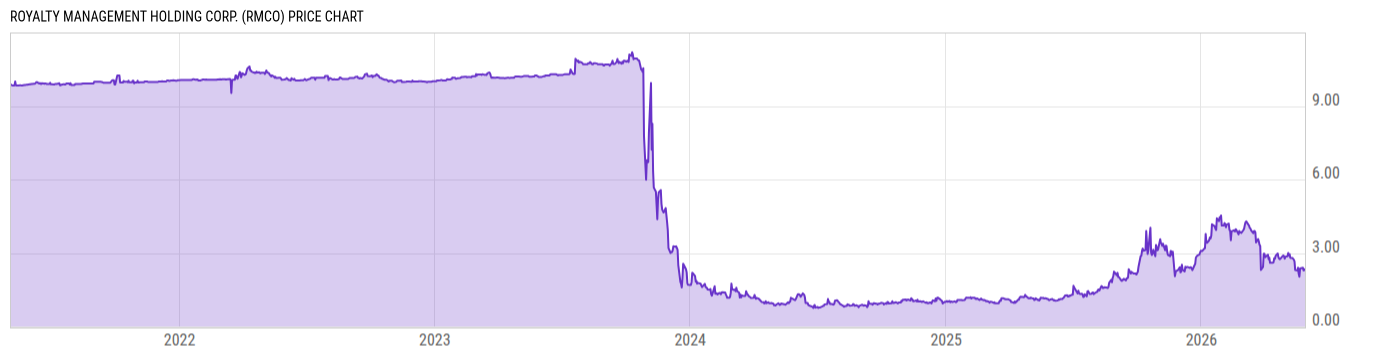
Royalty Management Holding Corp. (RMCO)
2.30
-0.03
(-1.29%)
USD |
NASDAQ |
May 29, 16:00
2.20
-0.10
(-4.35%)
After-Hours: 20:00
Price Chart
Key Stats
| Price and Performance | |
|---|---|
| Market Cap | 34.87M |
| 52 Week High (Daily) | |
| 52 Week Low (Daily) | |
| All-Time High (Daily) | |
| Year to Date Total Returns (Daily) | |
| 1 Month Total Returns (Daily) | |
| 1 Year Total Returns (Daily) | 113.0% |
| Valuation | |
| PE Ratio | -- |
| PE Ratio (Forward) | |
| PS Ratio | 6.108 |
| Price to Book Value | 3.238 |
| EV to EBITDA | |
| Dividend | |
|---|---|
| Dividend | 0.0025 |
| Dividend Yield (Forward) | |
| Financials | |
| Revenue (5 Year Growth) | |
| Revenue (Quarterly YoY Growth) | |
| EPS Diluted (5 Year Growth) | |
| EPS Diluted (Quarterly YoY Growth) | |
| Debt to Equity Ratio | 0.0363 |
| Return on Equity | |
| Return on Assets | |
| Risk | |
| Beta (5Y) | |
| Max Drawdown (5Y) | -- |
Profile
| Royalty Management Holding Corp.is a blank check company which engages in merger, share exchange, asset acquisition, stock purchase, recapitalization, reorganization or other similar business combination with one or more target businesses. The company was founded on June 21, 2021 and is headquartered in Fishers, IN. |
| URL | http://www.royaltymgmtcorp.com |
| Investor Relations URL | https://www.royaltymgmtcorp.com/Public |
| HQ State/Province | Indiana |
| Sector | Industrials |
| Industry | Commercial Services & Supplies |
| Next Earnings Release | N/A |
| Last Earnings Release | N/A |
| Next Ex-Dividend Date | Jun. 30, 2026 |
| Last Ex-Dividend Date | Mar. 31, 2026 |