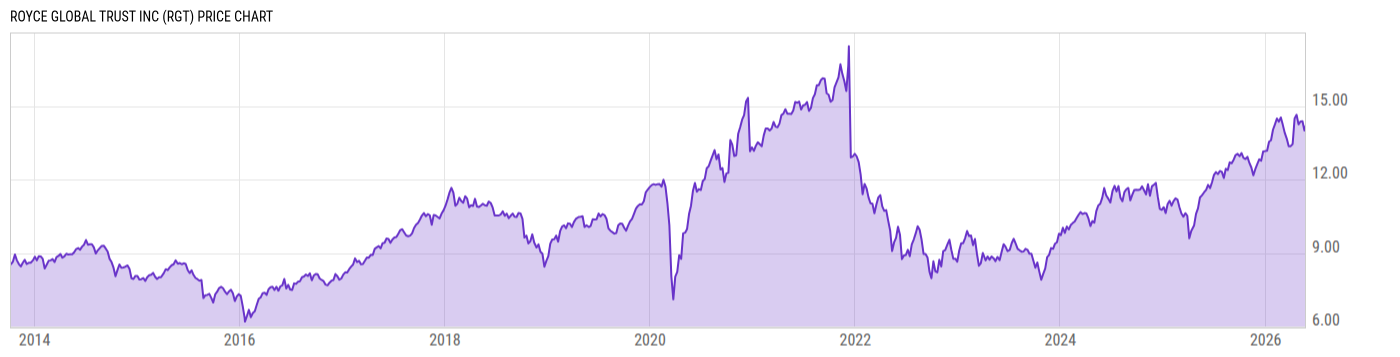
Key Stats

Expense Ratio Discount or Premium to NAV Total Assets Under Management 30-Day Average Daily Volume
1.54% -16.72% 65.50M 13351.10
Dividend Yield Turnover Ratio 1 Year Fund Level Flows Max Drawdown (All)
1.11% 24.00% -336054.9 Upgrade

Basic Info

Investment Strategy
The investment objective of the fund is long-term growth of capital.The Fund will invest at least 80% of its NAV in equity securities, such as common stock and preferred stock, and at least 40% of its NAV in the equity securities of companies located in at least three countries outside of the United States.
General
Security Type Closed-End Fund
Equity Style Small Cap/Blend
Fixed Income Style --
Broad Asset Class International Equity
Broad Category Equity
Category Name Global Small/Mid Stock
Category Index MSCI ACWI SMID NR USD
Global Category Name Global Equity Mid/Small Cap
YCharts Categorization Global Equity Mid/Small Cap
YCharts Benchmark MSCI ACWI Mid Cap (^MSACWIMCAP)
Prospectus Objective World Stock
Fund Owner Firm Name Franklin Templeton Investments
Prospectus Benchmark Index
MSCI ACWI Small NR USD 100.0%
Broad Asset Class Benchmark Index
^MSACXUSNTR 100.0%
Manager Tenure
Charles Royce 9.37 yrs

Net Fund Flows Versus Category

View Net Fund Flows. Upgrade now.
1M
3M
6M
YTD
1Y
3Y
5Y
10Y
 
80.00B
60.00B
40.00B
20.00B
0
-20.00B
1 Month
% Rank: --
-- Category Low
-- Category High
1 Year
% Rank: 47
-336054.9
-1.089B Category Low
726.57M Category High
3 Months
% Rank: --
-- Category Low
-- Category High
3 Years
% Rank: --
-- Category Low
-- Category High
6 Months
% Rank: --
-- Category Low
-- Category High
5 Years
% Rank: --
-- Category Low
-- Category High
YTD
% Rank: --
-- Category Low
-- Category High
10 Years
% Rank: --
-- Category Low
-- Category High
As of January 31, 2018

Performance Versus Category

 
20%
15%
10%
5%
0
View Category Returns. Upgrade now.
Name
1M
3M
YTD
1Y
3Y
5Y
10Y
15Y
Total Return (Price)
--
--
--
--
--
--
--
--
Total Return (NAV)
--
--
--
--
--
--
--
--
Category Rtn. (NAV)
--
--
--
--
--
--
--
--
% Rank in Cat (NAV)
--
--
--
--
--
--
--
--
As of March 28, 2023. Returns for periods of 1 year and above are annualized.

Annual Total Returns Versus Peers

Loading chart...
Name
2016
2017
2018
2019
2020
2021
2022
YTD
9.75%
35.99%
-17.52%
32.35%
23.82%
16.94%
-33.13%
0.32%
4.50%
27.19%
-14.20%
21.51%
10.65%
7.82%
-16.00%
4.24%
8.42%
34.90%
-19.49%
25.23%
4.99%
21.18%
-28.14%
1.90%
3.61%
8.21%
-27.64%
47.27%
-5.10%
24.46%
-20.27%
3.96%
3.08%
20.19%
-23.24%
27.04%
18.11%
30.14%
-25.49%
1.15%
--
--
--
--
--
--
--
0.94%
As of March 28, 2023.

Fundamentals

General
Distribution Yield Upgrade
Dividend Yield TTM (3-28-23) 1.11%
30-Day SEC Yield --
7-Day SEC Yield --
Number of Holdings Upgrade
Stock
Weighted Average PE Ratio 17.91
Weighted Average Price to Sales Ratio Upgrade
Weighted Average Price to Book Ratio Upgrade
Weighted Median ROE Upgrade
Weighted Median ROA Upgrade
Forecasted Dividend Yield Upgrade
Forecasted PE Ratio Upgrade
Forecasted Price to Sales Ratio Upgrade
Forecasted Price to Book Ratio Upgrade
As of December 31, 2022

Growth Estimates

Forecasted 5 Yr Earnings Growth Upgrade
Forecasted Book Value Growth Upgrade
Forecasted Cash Flow Growth Upgrade
Forecasted Earnings Growth Upgrade
Forecasted Revenue Growth Upgrade
As of December 31, 2022

Asset Allocation

As of December 31, 2022.
Type % Net % Long % Short
Cash -5.12% Upgrade Upgrade
Stock 105.1% Upgrade Upgrade
Bond 0.00% Upgrade Upgrade
Convertible 0.00% Upgrade Upgrade
Preferred 0.00% Upgrade Upgrade
Other 0.00% Upgrade Upgrade

Top 10 Holdings

Name % Weight Price % Change
Vistry Group PLC
3.07% -- --
EVI Industries Inc 2.97% 20.19 4.61%
IPH Ltd
2.33% -- --
SEI Investments Co 2.17% 55.83 0.65%
KBR Inc 2.07% 52.60 -0.45%
Tel Aviv Stock Exchange Ltd Ordinary Shares
2.05% -- --
Ziff Davis Inc 2.04% 75.35 -0.62%
APi Group Corp 1.86% 21.64 0.65%
Transcat Inc 1.79% 89.32 1.19%
Morningstar Inc 1.79% 186.34 1.19%

Basic Info

Investment Strategy
The investment objective of the fund is long-term growth of capital.The Fund will invest at least 80% of its NAV in equity securities, such as common stock and preferred stock, and at least 40% of its NAV in the equity securities of companies located in at least three countries outside of the United States.
General
Security Type Closed-End Fund
Equity Style Small Cap/Blend
Fixed Income Style --
Broad Asset Class International Equity
Broad Category Equity
Category Name Global Small/Mid Stock
Category Index MSCI ACWI SMID NR USD
Global Category Name Global Equity Mid/Small Cap
YCharts Categorization Global Equity Mid/Small Cap
YCharts Benchmark MSCI ACWI Mid Cap (^MSACWIMCAP)
Prospectus Objective World Stock
Fund Owner Firm Name Franklin Templeton Investments
Prospectus Benchmark Index
MSCI ACWI Small NR USD 100.0%
Broad Asset Class Benchmark Index
^MSACXUSNTR 100.0%
Manager Tenure
Charles Royce 9.37 yrs

Fundamentals

General
Distribution Yield Upgrade
Dividend Yield TTM (3-28-23) 1.11%
30-Day SEC Yield --
7-Day SEC Yield --
Number of Holdings Upgrade
Stock
Weighted Average PE Ratio 17.91
Weighted Average Price to Sales Ratio Upgrade
Weighted Average Price to Book Ratio Upgrade
Weighted Median ROE Upgrade
Weighted Median ROA Upgrade
Forecasted Dividend Yield Upgrade
Forecasted PE Ratio Upgrade
Forecasted Price to Sales Ratio Upgrade
Forecasted Price to Book Ratio Upgrade
As of December 31, 2022

Growth Estimates

Forecasted 5 Yr Earnings Growth Upgrade
Forecasted Book Value Growth Upgrade
Forecasted Cash Flow Growth Upgrade
Forecasted Earnings Growth Upgrade
Forecasted Revenue Growth Upgrade
As of December 31, 2022

Fund Details

Key Dates
Inception Date 10/18/2013
Last Annual Report Date 12/31/2022
Last Prospectus Date 7/29/2013
Attributes
Index Fund No
Inverse Fund No
Leveraged Fund Yes
Fund of Funds No
Currency Hedged Fund No
Synthetic Replication Fund No
Has Dividend Investment Plan Yes
Socially Responsible Fund No

Top Portfolio Holders

0 of 0