

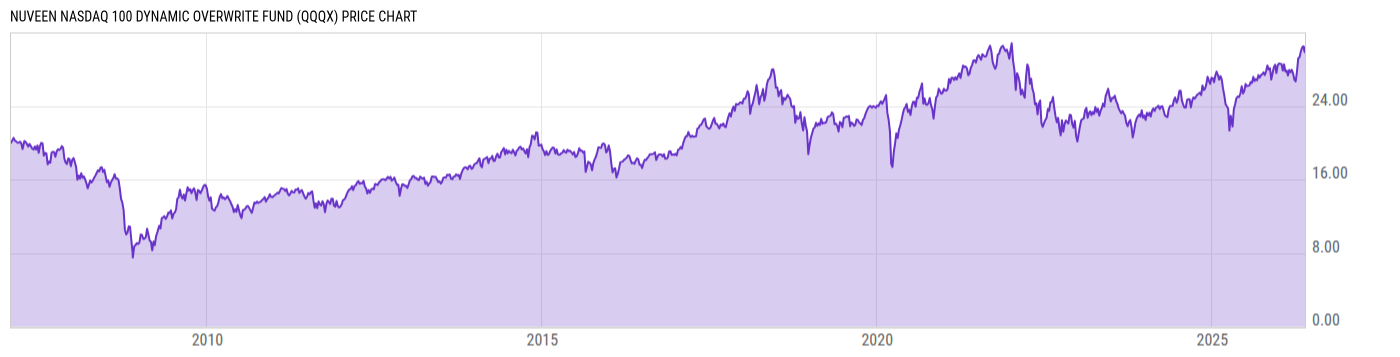
Nuveen NASDAQ 100 Dynamic Overwrite Fund (QQQX)
30.49
+0.12
(+0.40%)
USD |
NASDAQ |
May 21, 16:00
30.40
-0.09
(-0.30%)
After-Hours: 19:59
Price Chart
Key Stats
| Net Expense Ratio | Discount or Premium to NAV | Total Assets Under Management | 30-Day Average Daily Volume |
|---|---|---|---|
| 0.89% | -6.33% | -- | 92050.53 |
| Weighted Average Dividend Yield | Turnover Ratio (Generic) | 1 Year Fund Level Flows | Max Drawdown (Since Inception) |
| 0.65% | 31.00% | -- |
Basic Info
| Investment Strategy | |
| The Fund seeks attractive total return with less volatility than the Nasdaq 100 Index. The Fund will invest at least 80% of assets in a portfolio made up of securities comprising the Index that seeks to substantially replicate price movements of the Nasdaq 100 Index and is designed to support the Funds Option Strategy. |
| General | |
| Security Type | Closed-End Fund |
| Equity Style | Large Cap Growth |
| Broad Asset Class | Nontraditional Equity |
| Broad Category | Alternative Strategies |
| Global Peer Group | Alternative Relative Value |
| Peer Group | Options Arbitrage/Opt Strategies Funds |
| Global Macro | Liquid Alternatives |
| US Macro | Equity Income Funds |
| YCharts Categorization | -- |
| YCharts Benchmark | -- |
| Prospectus Objective | Options Arbitrage/Opt Strategies Funds |
| Fund Owner Firm Name | Nuveen |
| Broad Asset Class Benchmark Index | |
| ^SPXTR | 100.0% |
Performance Versus Peer Group
Annual Total Returns Versus Peers
As of May 22, 2026.
Asset Allocation
As of March 31, 2026.
| Type | % Net |
|---|---|
| Cash | 2.01% |
| Stock | 100.6% |
| Bond | 0.00% |
| Convertible | 0.00% |
| Preferred | 0.00% |
| Other | -2.63% |
Basic Info
| Investment Strategy | |
| The Fund seeks attractive total return with less volatility than the Nasdaq 100 Index. The Fund will invest at least 80% of assets in a portfolio made up of securities comprising the Index that seeks to substantially replicate price movements of the Nasdaq 100 Index and is designed to support the Funds Option Strategy. |
| General | |
| Security Type | Closed-End Fund |
| Equity Style | Large Cap Growth |
| Broad Asset Class | Nontraditional Equity |
| Broad Category | Alternative Strategies |
| Global Peer Group | Alternative Relative Value |
| Peer Group | Options Arbitrage/Opt Strategies Funds |
| Global Macro | Liquid Alternatives |
| US Macro | Equity Income Funds |
| YCharts Categorization | -- |
| YCharts Benchmark | -- |
| Prospectus Objective | Options Arbitrage/Opt Strategies Funds |
| Fund Owner Firm Name | Nuveen |
| Broad Asset Class Benchmark Index | |
| ^SPXTR | 100.0% |