

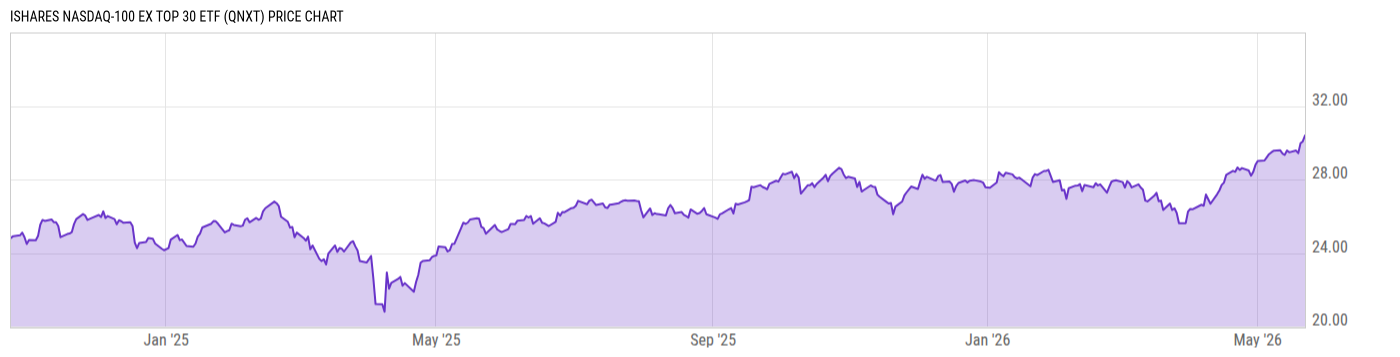
iShares Nasdaq-100 ex Top 30 ETF (QNXT)
30.39
+0.32
(+1.06%)
USD |
NASDAQ |
May 22, 16:00
Price Chart
Key Stats
| Net Expense Ratio | Discount or Premium to NAV | Total Assets Under Management | 30-Day Average Daily Volume |
|---|---|---|---|
| 0.20% | 0.03% | 18.23M | 1127.23 |
| Weighted Average Dividend Yield | Turnover Ratio (Generic) | 1 Year Fund Level Flows | Max Drawdown (Since Inception) |
| 0.83% | -- | -134888.0 |
Basic Info
| Investment Strategy | |
| The Fund seeks to track the investment results of the Nasdaq-100 ex Top 30 Index (the "Underlying Index"), which measures the performance of approximately 70 securities of domestic and international non-financial companies listed on Nasdaq based on market capitalization, as determined by Nasdaq, Inc. ("Index Provider"). |
| General | |
| Security Type | Exchange-Traded Fund |
| Equity Style | Multi Cap Core |
| Broad Asset Class | International Equity |
| Broad Category | Equity |
| Global Peer Group | Equity Global |
| Peer Group | Global Large-Cap Core |
| Global Macro | Equity Global |
| US Macro | Developed Global Markets Funds |
| YCharts Categorization | -- |
| YCharts Benchmark | -- |
| Prospectus Objective | Global Funds |
| Fund Owner Firm Name | BlackRock |
| Broad Asset Class Benchmark Index | |
| ^MSACXUSNTR | 100.0% |
Performance Versus Peer Group
Annual Total Returns Versus Peers
As of May 23, 2026.
Asset Allocation
As of April 30, 2026.
| Type | % Net |
|---|---|
| Cash | 0.00% |
| Stock | 99.87% |
| Bond | 0.12% |
| Convertible | 0.00% |
| Preferred | 0.00% |
| Other | 0.01% |
Basic Info
| Investment Strategy | |
| The Fund seeks to track the investment results of the Nasdaq-100 ex Top 30 Index (the "Underlying Index"), which measures the performance of approximately 70 securities of domestic and international non-financial companies listed on Nasdaq based on market capitalization, as determined by Nasdaq, Inc. ("Index Provider"). |
| General | |
| Security Type | Exchange-Traded Fund |
| Equity Style | Multi Cap Core |
| Broad Asset Class | International Equity |
| Broad Category | Equity |
| Global Peer Group | Equity Global |
| Peer Group | Global Large-Cap Core |
| Global Macro | Equity Global |
| US Macro | Developed Global Markets Funds |
| YCharts Categorization | -- |
| YCharts Benchmark | -- |
| Prospectus Objective | Global Funds |
| Fund Owner Firm Name | BlackRock |
| Broad Asset Class Benchmark Index | |
| ^MSACXUSNTR | 100.0% |