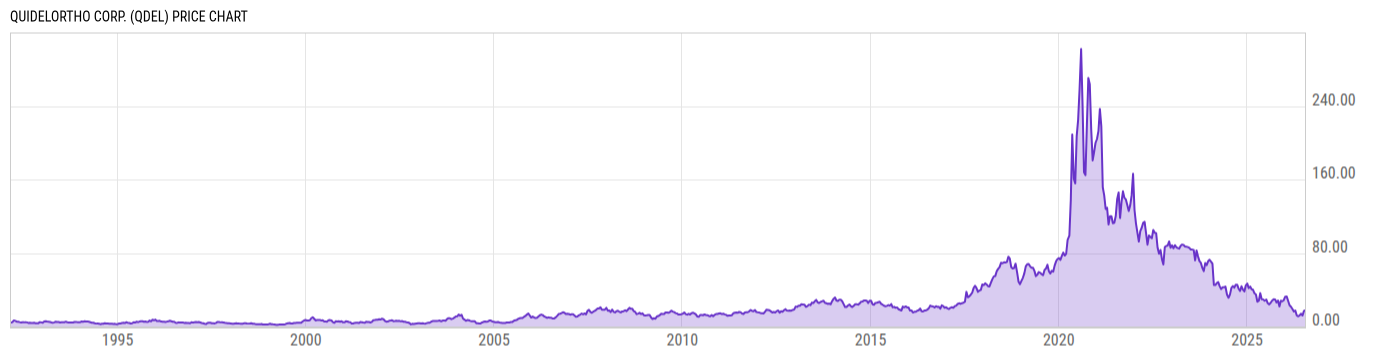
QuidelOrtho Corp (QDEL)
86.59
+0.98 (+1.14%)
USD |
NASDAQ |
Feb 01, 09:50
Price Chart
Key Stats
Price and Performance | |
---|---|
Market Cap | 5.719B |
52 Week High (Daily) | Upgrade |
52 Week Low (Daily) | Upgrade |
All-Time High (Daily) | Upgrade |
Year to Date Total Returns (Daily) | Upgrade |
1 Month Total Returns (Daily) | Upgrade |
1 Year Total Returns (Daily) | -17.17% |
Valuation | |
PE Ratio | 4.606 |
PE Ratio (Forward) | Upgrade |
PS Ratio | 1.475 |
Price to Book Value | 1.193 |
EV to EBITDA | Upgrade |
Dividend | |
---|---|
Dividend | -- |
Dividend Yield (Forward) | Upgrade |
Financials | |
Revenue (5 Year Growth) | Upgrade |
Revenue (Quarterly YoY Growth) | Upgrade |
EPS Diluted (5 Year Growth) | Upgrade |
EPS Diluted (Quarterly YoY Growth) | Upgrade |
Debt to Equity Ratio | 0.5609 |
Return on Equity | Upgrade |
Return on Assets | Upgrade |
Risk | |
Beta (5Y) | Upgrade |
Max Drawdown (5Y) | 77.65% |
News
Headline
Wire
Time (ET)
SA Breaking News
01/30 07:00
SA Breaking News
01/11 10:41
Yahoo
01/06 16:05
Events
DATE | TIME | TYPE | PERIOD | REPORTED EPS |
ESTIMATED EPS |
SURPRISE | |
02/15/2023 | 17:00 EST | Earnings Call | Q4 2022 | -- | -- | -- | |
02/15/2023 | -- | Results | Q4 2022 | -- | 1.42 | -- | |
11/02/2022 | 17:00 EST | Earnings Call | Q3 2022 | -- | -- | -- | |
11/02/2022 | -- | Results | Q3 2022 | 1.85 | 0.69 | 167.0% | |
08/04/2022 | 17:00 EST | Earnings Call | Q2 2022 | -- | -- | -- | |
08/04/2022 | -- | Results | Q2 2022 | 2.34 | 2.68 | -12.69% | |
05/04/2022 | 17:00 EST | Earnings Call | Q1 2022 | -- | -- | -- | |
05/04/2022 | -- | Results | Q1 2022 | 11.66 | 9.43 | 23.69% |
*Estimated Date/Time
Earnings
Profile
Edit
QuidelOrtho Corp is engaged in the development, manufacturing, and marketing of rapid diagnostic testing solutions. The company's comprehensive product portfolio covers a wide range of point-of-care tests for infectious diseases, critical cardiac health and autoimmune biomarkers, and a host of clinical and at-home products to detect COVID-19. |
URL | https://www.ir.quidelortho.com |
Investor Relations URL | https://ir.quidel.com/ |
HQ State/Province | California |
Sector | Healthcare |
Industry | Medical Instruments & Supplies |
Equity Style | Small Cap/Blend |
Next Earnings Release | Feb. 15, 2023 |
Last Earnings Release | Nov. 02, 2022 |
Next Ex-Dividend Date | N/A |
Last Ex-Dividend Date | N/A |
Analyst Coverage
Consensus Rating
|
|
Analyst Recommendation
|
Source: S&P Global
Dividends
Dividend Per Share (TTM) | -- |
2017
2018
2019
2020
2021
6.00%
4.00%
2.00%
|
|
Yield to Market | 0.00 |
Yield to Sector | 0.00 |
Yield to Industry | 0.00 |
Last Dividend Amt. | -- |
Dividend Frequency | -- |
Last Ex-Dividend Date | -- |
Yield (TTM) | 0% |
Forward Yield | -- |
Payout Ratio | 0.00% |
Cash Payout Ratio | 0.00% |
Consistent Payer (5Y) | No |
Consistent Growth (5Y) | No |
Risk Info
Total Returns Comparison
Annual Total Returns Versus Peers
As of January 31, 2023.
Fundamentals
Revenue (TTM) | 3.036B |
Total Expenses (TTM) | 1.785B |
Net Income (TTM) | 809.75M |
Total Assets (Quarterly) | 8.656B |
Total Liabilities (Quarterly) | 3.860B |
Shareholders Equity (Quarterly) | 4.795B |
Cash from Operations (TTM) | 1.037B |
Cash from Investing (TTM) | -1.681B |
Cash from Financing (TTM) | 282.74M |
Ratings
Profile
Edit
QuidelOrtho Corp is engaged in the development, manufacturing, and marketing of rapid diagnostic testing solutions. The company's comprehensive product portfolio covers a wide range of point-of-care tests for infectious diseases, critical cardiac health and autoimmune biomarkers, and a host of clinical and at-home products to detect COVID-19. |
URL | https://www.ir.quidelortho.com |
Investor Relations URL | https://ir.quidel.com/ |
HQ State/Province | California |
Sector | Healthcare |
Industry | Medical Instruments & Supplies |
Equity Style | Small Cap/Blend |
Next Earnings Release | Feb. 15, 2023 |
Last Earnings Release | Nov. 02, 2022 |
Next Ex-Dividend Date | N/A |
Last Ex-Dividend Date | N/A |
Risk Info
Ownership
Insider Ownership Percentage | Upgrade |
Jul '20
Nov '20
Mar '21
80.00%
40.00%
10.00%
Analyst Coverage
Consensus Rating
|
|
Analyst Recommendation
|
Source: S&P Global
Top Fund Holders
Symbol | Dollars Invested | % Weight |
---|---|---|
GERM | 829008.0 USD | 3.57% |
HVAX.TO | 72034.00 USD | 3.28% |
AOFCX | 83.94M USD | 2.86% |
MSGCX | 18.64M USD | 2.51% |
MRCGX | 32.87M USD | 2.47% |
FHH.F.TO | 385227.0 USD | 2.22% |
FXH | 33.30M USD | 2.03% |
TDB3505 | 8.840M USD | 1.73% |
JSMD | 2.566M USD | 1.35% |
DJT00675 | 15.20M USD | 1.03% |
ZGEN.TO | 30623.00 USD | 0.70% |
FSCFX | 39.35M USD | 0.51% |
Other Resources
Whale Wisdom | 13F Filings |
Seeking Alpha | Call Transcripts |
Nasdaq | Insider Trading |
Nasdaq | Institutional Ownership |
Nasdaq | Option Chain |
SEC | SEC Filings |
QDEL Tweets |