

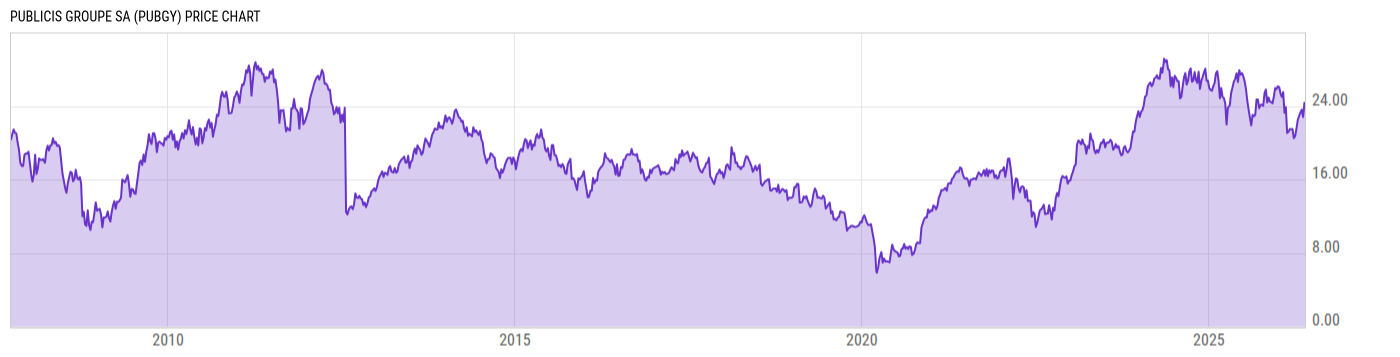
Publicis Groupe SA (PUBGY)
25.46
+0.39
(+1.56%)
USD |
OTCM |
Jun 08, 16:00
Price Chart
Key Stats
| Price and Performance | |
|---|---|
| Market Cap | 18.70B |
| 52 Week High (Daily) | |
| 52 Week Low (Daily) | |
| All-Time High (Daily) | |
| Year to Date Total Returns (Daily) | |
| 1 Month Total Returns (Daily) | |
| 1 Year Total Returns (Daily) | -2.48% |
| Valuation | |
| PE Ratio | 13.82 |
| PE Ratio (Forward) | |
| PS Ratio | 1.312 |
| Price to Book Value | -- |
| EV to EBITDA | |
| Dividend | |
|---|---|
| Dividend | 1.101 |
| Dividend Yield (Forward) | |
| Financials | |
| Revenue (5 Year Growth) | |
| Revenue (Quarterly YoY Growth) | |
| EPS Diluted (5 Year Growth) | |
| EPS Diluted (Quarterly YoY Growth) | |
| Debt to Equity Ratio | -- |
| Return on Equity | |
| Return on Assets | |
| Risk | |
| Beta (5Y) | |
| Max Drawdown (5Y) | 39.93% |
Profile
| Publicis Groupe SA engages in advertising and public relations business. The firm's services include customer relationship management; direct marketing; sales promotion; events management; public relations; and corporate, multicultural, and financial communications. It operates through the following geographical segments: North America, Europe, Asia-Pacific, The Middle East and Africa, and Latin America. The company was founded by Marcel Bleustein-Blanchet in 1926 and is headquartered in Paris, France. |
| URL | http://www.publicisgroupe.com |
| Investor Relations URL | https://www.publicisgroupe.com/en/investors/investors-analysts/ |
| HQ State/Province | Ile-de-France |
| Sector | Communication Services |
| Industry | Media |
| Next Earnings Release | Jul. 16, 2026 (est.) |
| Last Earnings Release | Feb. 03, 2026 |
| Next Ex-Dividend Date | Jun. 30, 2026 |
| Last Ex-Dividend Date | Jun. 30, 2025 |