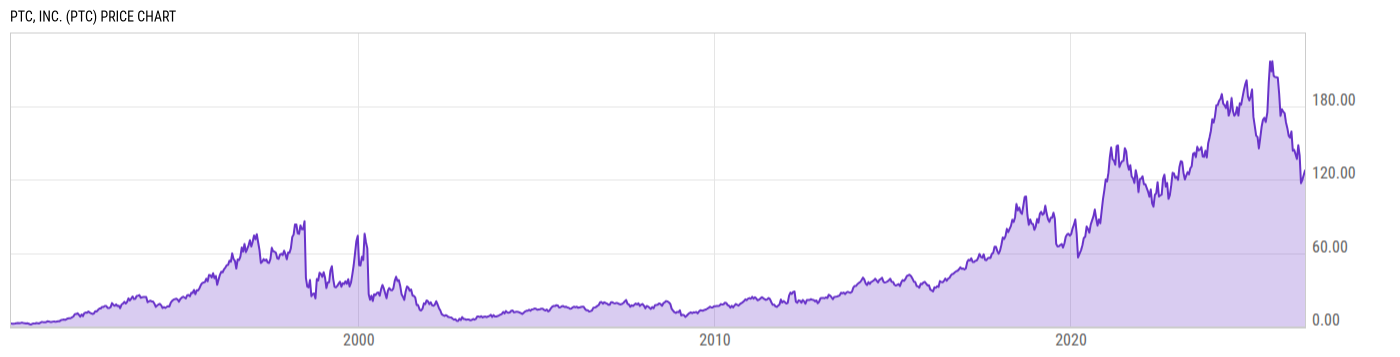
PTC Inc (PTC)
135.09
-0.68 (-0.50%)
USD |
NASDAQ |
Jan 27, 16:00
135.15
+0.06 (+0.04%)
After-Hours: 20:00
Price Chart
Key Stats
Price and Performance | |
---|---|
Market Cap | 15.96B |
52 Week High (Daily) | Upgrade |
52 Week Low (Daily) | Upgrade |
All-Time High (Daily) | Upgrade |
Year to Date Total Returns (Daily) | Upgrade |
1 Month Total Returns (Daily) | Upgrade |
1 Year Total Returns (Daily) | 23.06% |
Valuation | |
PE Ratio | 50.98 |
PE Ratio (Forward) | Upgrade |
PS Ratio | 8.263 |
Price to Book Value | 6.952 |
EV to EBITDA | Upgrade |
Dividend | |
---|---|
Dividend | -- |
Dividend Yield (Forward) | Upgrade |
Financials | |
Revenue (5 Year Growth) | Upgrade |
Revenue (Quarterly YoY Growth) | Upgrade |
EPS Diluted (5 Year Growth) | Upgrade |
EPS Diluted (Quarterly YoY Growth) | Upgrade |
Debt to Equity Ratio | 0.5882 |
Return on Equity | Upgrade |
Return on Assets | Upgrade |
Risk | |
Beta (5Y) | Upgrade |
Max Drawdown (5Y) | 54.37% |
News
Headline
Wire
Time (ET)
MT Newswires
01/27 11:47
MT Newswires
01/26 08:56
Yahoo
01/23 12:55
MT Newswires
01/23 07:55
Yahoo
01/16 07:14
MT Newswires
01/11 07:51
Events
DATE | TIME | TYPE | PERIOD | REPORTED EPS |
ESTIMATED EPS |
SURPRISE | |
02/01/2023 | -- | Results | Q1 2023 | -- | 1.03 | -- | |
02/01/2023 | 17:00 EST | Earnings Call | Q1 2023 | -- | -- | -- | |
11/02/2022 | 17:00 EST | Earnings Call | Q4 2022 | -- | -- | -- | |
11/02/2022 | -- | Results | Q4 2022 | 1.27 | 1.15 | 10.19% | |
07/27/2022 | -- | Results | Q3 2022 | 0.97 | 1.06 | -8.83% | |
07/27/2022 | 17:00 EST | Earnings Call | Q3 2022 | -- | -- | -- | |
04/27/2022 | -- | Results | Q2 2022 | 1.39 | 1.13 | 23.49% | |
04/27/2022 | 17:00 EST | Earnings Call | Q2 2022 | -- | -- | -- |
*Estimated Date/Time
Earnings
Profile
Edit
PTC offers high-end computer-assisted design (Creo) and product lifecycle management (Windchill) software as well as Internet of Things and AR industrial solutions. Founded in 1985, PTC has 28,000 customers, with revenue stemming mostly from North America (45%) and Europe (40%). |
URL | https://www.ptc.com |
Investor Relations URL | https://investor.ptc.com/investor-overview/default.aspx |
HQ State/Province | Massachusetts |
Sector | Technology |
Industry | Software - Application |
Equity Style | Mid Cap/Growth |
Next Earnings Release | Feb. 01, 2023 |
Last Earnings Release | Nov. 02, 2022 |
Next Ex-Dividend Date | N/A |
Last Ex-Dividend Date | N/A |
Analyst Coverage
Consensus Rating
|
|
Analyst Recommendation
|
Source: S&P Global
Dividends
Dividend Per Share (TTM) | -- |
2017
2018
2019
2020
2021
6.00%
4.00%
2.00%
|
|
Yield to Market | 0.00 |
Yield to Sector | 0.00 |
Yield to Industry | 0.00 |
Last Dividend Amt. | -- |
Dividend Frequency | -- |
Last Ex-Dividend Date | -- |
Yield (TTM) | 0.00% |
Forward Yield | -- |
Payout Ratio | 0.00% |
Cash Payout Ratio | 0.00% |
Consistent Payer (5Y) | No |
Consistent Growth (5Y) | No |
Risk Info
Total Returns Comparison
Annual Total Returns Versus Peers
As of January 27, 2023.
Fundamentals
Revenue (TTM) | 1.933B |
Total Expenses (TTM) | 1.455B |
Net Income (TTM) | 313.08M |
Total Assets (Quarterly) | 4.687B |
Total Liabilities (Quarterly) | 2.391B |
Shareholders Equity (Quarterly) | 2.296B |
Cash from Operations (TTM) | 435.33M |
Cash from Investing (TTM) | -201.20M |
Cash from Financing (TTM) | -264.08M |
Ratings
Profile
Edit
PTC offers high-end computer-assisted design (Creo) and product lifecycle management (Windchill) software as well as Internet of Things and AR industrial solutions. Founded in 1985, PTC has 28,000 customers, with revenue stemming mostly from North America (45%) and Europe (40%). |
URL | https://www.ptc.com |
Investor Relations URL | https://investor.ptc.com/investor-overview/default.aspx |
HQ State/Province | Massachusetts |
Sector | Technology |
Industry | Software - Application |
Equity Style | Mid Cap/Growth |
Next Earnings Release | Feb. 01, 2023 |
Last Earnings Release | Nov. 02, 2022 |
Next Ex-Dividend Date | N/A |
Last Ex-Dividend Date | N/A |
Risk Info
Ownership
Insider Ownership Percentage | Upgrade |
Jul '20
Nov '20
Mar '21
80.00%
40.00%
10.00%
Analyst Coverage
Consensus Rating
|
|
Analyst Recommendation
|
Source: S&P Global
Top Fund Holders
Symbol | Dollars Invested | % Weight |
---|---|---|
BOPCX | 16.91M USD | 3.55% |
GOFFX | 152.65M USD | 3.32% |
NUMG | 7.665M USD | 2.10% |
CHCCX | 48.12M USD | 1.74% |
RYT | 31.78M USD | 1.39% |
FSCSX | 107.72M USD | 1.22% |
IGV | 37.55M USD | 0.82% |
KOMP | 13.41M USD | 0.78% |
VISGX | 188.82M USD | 0.70% |
VBK | 188.82M USD | 0.70% |
NAESX | 327.00M USD | 0.29% |
VB | 327.00M USD | 0.29% |
Other Resources
Whale Wisdom | 13F Filings |
Seeking Alpha | Call Transcripts |
Nasdaq | Insider Trading |
Nasdaq | Institutional Ownership |
Nasdaq | Option Chain |
SEC | SEC Filings |
PTC Tweets |