

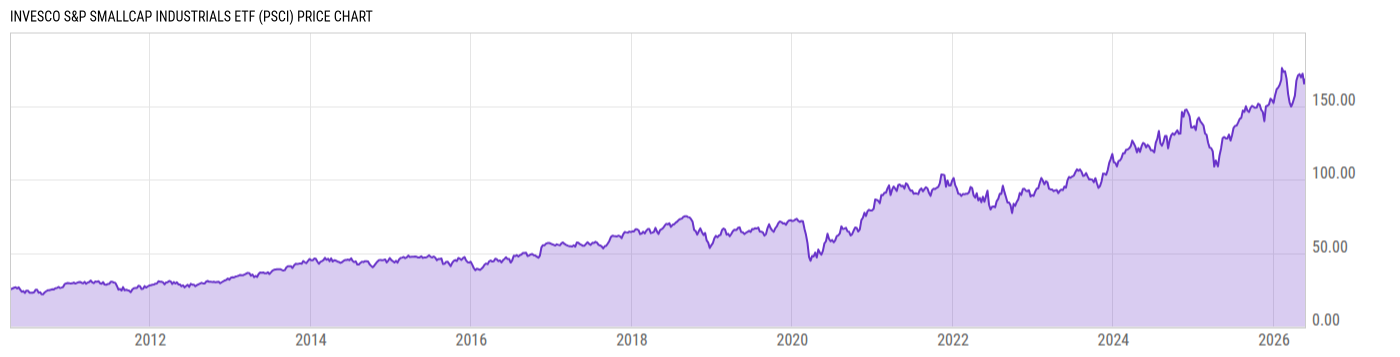
Invesco S&P SmallCap Industrials ETF (PSCI)
172.41
+1.32
(+0.77%)
USD |
NASDAQ |
Jun 09, 16:00
172.41
0.00 (0.00%)
After-Hours: 20:00
Price Chart
Key Stats
| Net Expense Ratio | Discount or Premium to NAV | Total Assets Under Management | 30-Day Average Daily Volume |
|---|---|---|---|
| 0.29% | 0.04% | 174.45M | 2972.80 |
| Weighted Average Dividend Yield | Turnover Ratio (Generic) | 1 Year Fund Level Flows | Max Drawdown (Since Inception) |
| 0.71% | 32.00% | 3.780M |
Basic Info
| Investment Strategy | |
| The Fund seeks to track the investment results of the S&P SmallCap 600 Capped Industrials Index. The Fund generally will invest at least 90% of its total assets in the securities of small-capitalization US industrial companies that comprise the Underlying Index in proportion to their weightings in the Underlying Index. |
| General | |
| Security Type | Exchange-Traded Fund |
| Equity Style | Small Cap Core |
| Broad Asset Class | Sector Equity |
| Broad Category | Equity |
| Global Peer Group | Equity Sector Industrials |
| Peer Group | Industrials Funds |
| Global Macro | Equity Industry Sector |
| US Macro | Sector Equity Funds |
| YCharts Categorization | -- |
| YCharts Benchmark | -- |
| Prospectus Objective | Industrials Funds |
| Fund Owner Firm Name | Invesco |
| Broad Asset Class Benchmark Index | |
| ^MSWNTR | 100.0% |
Performance Versus Peer Group
Annual Total Returns Versus Peers
As of June 09, 2026.
Asset Allocation
As of May 31, 2026.
| Type | % Net |
|---|---|
| Cash | 0.01% |
| Stock | 100.0% |
| Bond | 0.00% |
| Convertible | 0.00% |
| Preferred | 0.00% |
| Other | -0.02% |
Basic Info
| Investment Strategy | |
| The Fund seeks to track the investment results of the S&P SmallCap 600 Capped Industrials Index. The Fund generally will invest at least 90% of its total assets in the securities of small-capitalization US industrial companies that comprise the Underlying Index in proportion to their weightings in the Underlying Index. |
| General | |
| Security Type | Exchange-Traded Fund |
| Equity Style | Small Cap Core |
| Broad Asset Class | Sector Equity |
| Broad Category | Equity |
| Global Peer Group | Equity Sector Industrials |
| Peer Group | Industrials Funds |
| Global Macro | Equity Industry Sector |
| US Macro | Sector Equity Funds |
| YCharts Categorization | -- |
| YCharts Benchmark | -- |
| Prospectus Objective | Industrials Funds |
| Fund Owner Firm Name | Invesco |
| Broad Asset Class Benchmark Index | |
| ^MSWNTR | 100.0% |