

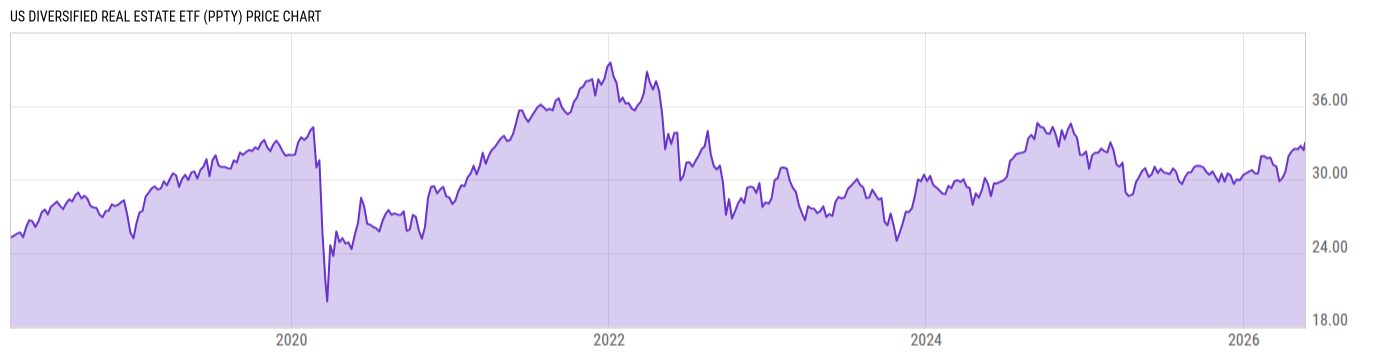
US Diversified Real Estate ETF (PPTY)
34.00
+0.77
(+2.31%)
USD |
NYSEARCA |
Jun 09, 16:00
33.95
-0.05
(-0.14%)
After-Hours: 20:00
Price Chart
Key Stats
| Net Expense Ratio | Discount or Premium to NAV | Total Assets Under Management | 30-Day Average Daily Volume |
|---|---|---|---|
| 0.53% | -0.04% | 25.51M | 1987.83 |
| Weighted Average Dividend Yield | Turnover Ratio (Generic) | 1 Year Fund Level Flows | Max Drawdown (Since Inception) |
| 3.79% | 13.00% | -19.38M |
Basic Info
| Investment Strategy | |
| The Fund seeks to track the performance, before fees and expenses, of the PPTYX US Diversified Real Estate Index. The Fund invests at least 80% in the component securities of the Index, designed to ensure diversification by property type and by location, while favoring companies with prudent leverage. |
| General | |
| Security Type | Exchange-Traded Fund |
| Equity Style | Mid Cap Core |
| Broad Asset Class | Sector Equity |
| Broad Category | Equity |
| Global Peer Group | Equity Sector Real Estate US |
| Peer Group | Real Estate Funds |
| Global Macro | Equity Real Estate |
| US Macro | Sector Equity Funds |
| YCharts Categorization | -- |
| YCharts Benchmark | -- |
| Prospectus Objective | Real Estate Funds |
| Fund Owner Firm Name | Vident Financial |
| Broad Asset Class Benchmark Index | |
| ^MSWNTR | 100.0% |
Performance Versus Peer Group
Annual Total Returns Versus Peers
As of June 10, 2026.
Asset Allocation
As of May 31, 2026.
| Type | % Net |
|---|---|
| Cash | 0.24% |
| Stock | 99.72% |
| Bond | 0.00% |
| Convertible | 0.00% |
| Preferred | 0.00% |
| Other | 0.04% |
Basic Info
| Investment Strategy | |
| The Fund seeks to track the performance, before fees and expenses, of the PPTYX US Diversified Real Estate Index. The Fund invests at least 80% in the component securities of the Index, designed to ensure diversification by property type and by location, while favoring companies with prudent leverage. |
| General | |
| Security Type | Exchange-Traded Fund |
| Equity Style | Mid Cap Core |
| Broad Asset Class | Sector Equity |
| Broad Category | Equity |
| Global Peer Group | Equity Sector Real Estate US |
| Peer Group | Real Estate Funds |
| Global Macro | Equity Real Estate |
| US Macro | Sector Equity Funds |
| YCharts Categorization | -- |
| YCharts Benchmark | -- |
| Prospectus Objective | Real Estate Funds |
| Fund Owner Firm Name | Vident Financial |
| Broad Asset Class Benchmark Index | |
| ^MSWNTR | 100.0% |