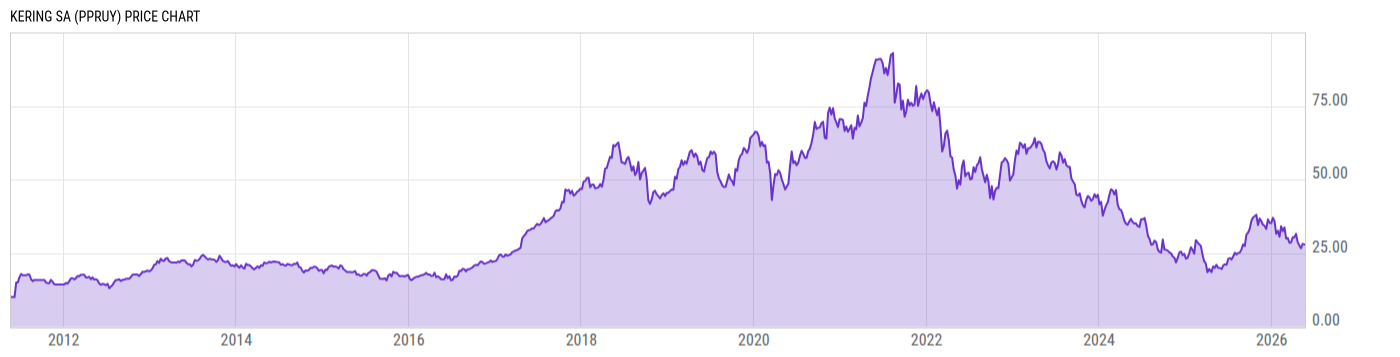
Kering SA (PPRUY)
61.88
+0.53
(+0.86%)
USD |
OTCM |
Mar 23, 16:00
Key Stats
Price and Performance | |
---|---|
Market Cap | 75.68B |
52 Week High (Daily) | Upgrade |
52 Week Low (Daily) | Upgrade |
All-Time High (Daily) | Upgrade |
Year to Date Total Returns (Daily) | Upgrade |
1 Month Total Returns (Daily) | Upgrade |
1 Year Total Returns (Daily) | -0.21% |
Valuation | |
PE Ratio | 20.19 |
PE Ratio (Forward) | Upgrade |
PS Ratio | 3.593 |
Price to Book Value | 5.041 |
EV to EBITDA | Upgrade |
Dividend | |
---|---|
Dividend | 0.4872 |
Dividend Yield (Forward) | Upgrade |
Financials | |
Revenue (5 Year Growth) | Upgrade |
Revenue (Quarterly YoY Growth) | Upgrade |
EPS Diluted (5 Year Growth) | Upgrade |
EPS Diluted (Quarterly YoY Growth) | Upgrade |
Debt to Equity Ratio | 0.4258 |
Return on Equity | Upgrade |
Return on Assets | Upgrade |
Risk | |
Beta (5Y) | Upgrade |
Max Drawdown (5Y) | 52.66% |
News
Headline
Wire
Time (ET)
SA Breaking News
05/20 11:54
SA Breaking News
07/23 19:30
Events
DATE | TIME | TYPE | PERIOD | REPORTED EPS |
ESTIMATED EPS |
SURPRISE | |
04/21/2023* | 18:00 EST | Earnings Call | Q1 2023 | -- | -- | -- | |
04/21/2023* | -- | Results | Q1 2023 | -- | -- | -- | |
02/15/2023 | -- | Results | Q4 2022 | -- | -- | -- | |
02/15/2023 | 02:30 EST | Earnings Call | Q4 2022 | -- | -- | -- | |
10/20/2022 | -- | Results | Q3 2022 | -- | -- | -- | |
07/27/2022 | -- | Results | Q2 2022 | -- | -- | -- | |
04/21/2022 | 12:00 EST | Earnings Call | Q1 2022 | -- | -- | -- | |
04/21/2022 | -- | Results | Q1 2022 | -- | -- | -- |
*Estimated Date/Time
Earnings
Profile
Edit
Kering is the world’s second-largest luxury goods conglomerate after LVMH. Its flagship brand is Gucci, which accounts for 55% of revenue and over 70% of operating profits. Its other leading brands include Bottega Veneta and YSL. Other smaller luxury brands (in ready-to-wear, leather goods, and jewellery) generate around 18% of sales. Alexander McQueen, Balenciaga and Boucheron are part of Kering’s portfolio. |
URL | https://www.kering.com |
Investor Relations URL | N/A |
HQ State/Province | N/A |
Sector | Consumer Cyclical |
Industry | Luxury Goods |
Equity Style | Large Cap/Blend |
Next Earnings Release | Apr. 21, 2023 (est.) |
Last Earnings Release | Feb. 15, 2023 |
Next Ex-Dividend Date | N/A |
Last Ex-Dividend Date | Jan. 12, 2023 |
Analyst Coverage
|
|
Low:--
High:--
|
|
Price Target Std Dev |
|
Price Target Upside (Daily) | Upgrade |
Price Target Num Estimates | Upgrade |
Consensus Rating
|
|
Analyst Recommendation
|
Source: S&P Global
Dividends
Dividend Per Share (TTM) | 1.287 |
2017
2018
2019
2020
2021
6.00%
4.00%
2.00%
|
|
Yield to Market | 1.609 |
Yield to Sector | 1.125 |
Yield to Industry | 0.6059 |
Last Dividend Amt. | 0.4872 |
Dividend Frequency | Semi-Annually |
Last Ex-Dividend Date | Jan. 12, 2023 |
Yield (TTM) | 2.24% |
Forward Yield | 2.24% |
Payout Ratio | 41.79% |
Cash Payout Ratio | 46.92% |
Consistent Payer (5Y) |
|
Consistent Growth (5Y) | No |
Risk
Total Returns Comparison
Annual Total Returns Versus Peers
As of March 23, 2023.
Fundamentals
Revenue (TTM) | 21.23B |
Total Expenses (TTM) | 15.40B |
Net Income (TTM) | 3.780B |
Total Assets (Quarterly) | 36.40B |
Total Liabilities (Quarterly) | 20.55B |
Shareholders Equity (Quarterly) | 15.01B |
Cash from Operations (TTM) | 4.477B |
Cash from Investing (TTM) | -2.853B |
Cash from Financing (TTM) | -2.240B |
Ratings
Profile
Edit
Kering is the world’s second-largest luxury goods conglomerate after LVMH. Its flagship brand is Gucci, which accounts for 55% of revenue and over 70% of operating profits. Its other leading brands include Bottega Veneta and YSL. Other smaller luxury brands (in ready-to-wear, leather goods, and jewellery) generate around 18% of sales. Alexander McQueen, Balenciaga and Boucheron are part of Kering’s portfolio. |
URL | https://www.kering.com |
Investor Relations URL | N/A |
HQ State/Province | N/A |
Sector | Consumer Cyclical |
Industry | Luxury Goods |
Equity Style | Large Cap/Blend |
Next Earnings Release | Apr. 21, 2023 (est.) |
Last Earnings Release | Feb. 15, 2023 |
Next Ex-Dividend Date | N/A |
Last Ex-Dividend Date | Jan. 12, 2023 |
Ownership
Insider Ownership Percentage | Upgrade |
Jul '20
Nov '20
Mar '21
80.00%
40.00%
10.00%
Analyst Coverage
|
|
Low:--
High:--
|
|
Price Target Std Dev |
|
Price Target Upside (Daily) | Upgrade |
Price Target Num Estimates | Upgrade |
Consensus Rating
|
|
Analyst Recommendation
|
Source: S&P Global
Top Fund Holders
Symbol | Dollars Invested | % Weight |
---|---|---|
FXLJIX | 359308.0 USD | 3.59% |
F00001E1JN | 359097.0 USD | 3.59% |
FQHSBX | 329908.0 USD | 3.30% |
F00001EKOX | 127300.0 USD | 1.27% |
QDISX | 2186.00 USD | 1.11% |
F00001E6AJ | 108794.0 USD | 1.09% |
Other Resources
Whale Wisdom | 13F Filings |
Seeking Alpha | Call Transcripts |
Nasdaq | Insider Trading |
Nasdaq | Institutional Ownership |
Nasdaq | Option Chain |
SEC | SEC Filings |
PPRUY Tweets |