

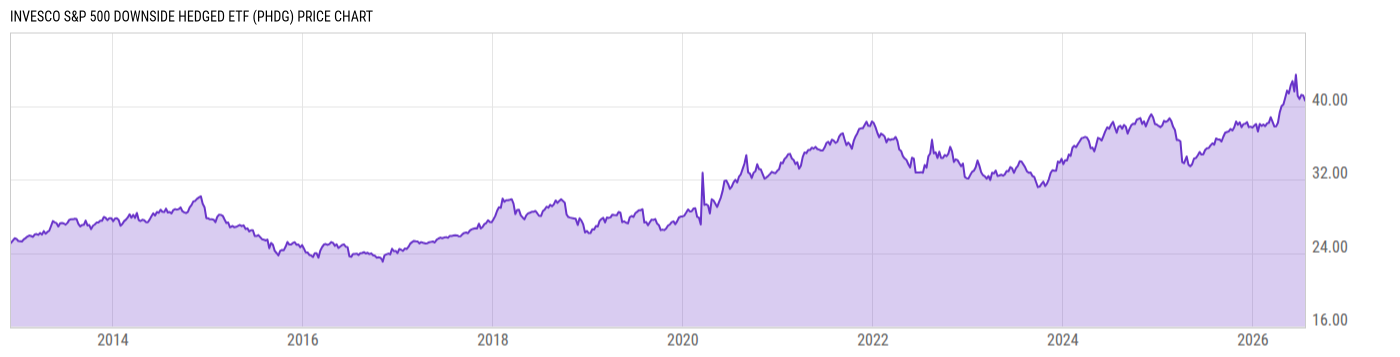
Invesco S&P 500 Downside Hedged ETF (PHDG)
40.60
-0.20
(-0.48%)
USD |
NYSEARCA |
Jul 20, 16:00
40.60
0.00 (0.00%)
After-Hours: 20:00
Price Chart
Key Stats
| Net Expense Ratio | Discount or Premium to NAV | Total Assets Under Management | 30-Day Average Daily Volume |
|---|---|---|---|
| 0.39% | 0.03% | 71.37M | 17068.90 |
| Weighted Average Dividend Yield | Turnover Ratio (Generic) | 1 Year Fund Level Flows | Max Drawdown (Since Inception) |
| -- | 929.0% | -28.02M |
Basic Info
| Investment Strategy | |
| The Fund seeks to achieve positive total returns in rising or falling markets that are not directly correlated to broad equity or fixed income market returns. The Fund uses a quantitative, rules-based strategy designed to provide returns that correspond to the performance of the S&P 500 Dynamic VEQTOR Index. |
| General | |
| Security Type | Exchange-Traded Fund |
| Equity Style | -- |
| Broad Asset Class | Alternative |
| Broad Category | Alternative Strategies |
| Global Peer Group | Absolute Return USD High |
| Peer Group | Absolute Return Funds |
| Global Macro | Absolute Return |
| US Macro | Alternative Equity Funds |
| YCharts Categorization | -- |
| YCharts Benchmark | -- |
| Prospectus Objective | Absolute Return Funds |
| Fund Owner Firm Name | Invesco |
| Broad Asset Class Benchmark Index | |
| ^MSACWINTR | 100.0% |
Performance Versus Peer Group
Annual Total Returns Versus Peers
As of July 20, 2026.
Asset Allocation
As of June 30, 2026.
| Type | % Net |
|---|---|
| Cash | 16.01% |
| Stock | 77.10% |
| Bond | 6.83% |
| Convertible | 0.00% |
| Preferred | 0.00% |
| Other | 0.06% |
Basic Info
| Investment Strategy | |
| The Fund seeks to achieve positive total returns in rising or falling markets that are not directly correlated to broad equity or fixed income market returns. The Fund uses a quantitative, rules-based strategy designed to provide returns that correspond to the performance of the S&P 500 Dynamic VEQTOR Index. |
| General | |
| Security Type | Exchange-Traded Fund |
| Equity Style | -- |
| Broad Asset Class | Alternative |
| Broad Category | Alternative Strategies |
| Global Peer Group | Absolute Return USD High |
| Peer Group | Absolute Return Funds |
| Global Macro | Absolute Return |
| US Macro | Alternative Equity Funds |
| YCharts Categorization | -- |
| YCharts Benchmark | -- |
| Prospectus Objective | Absolute Return Funds |
| Fund Owner Firm Name | Invesco |
| Broad Asset Class Benchmark Index | |
| ^MSACWINTR | 100.0% |