

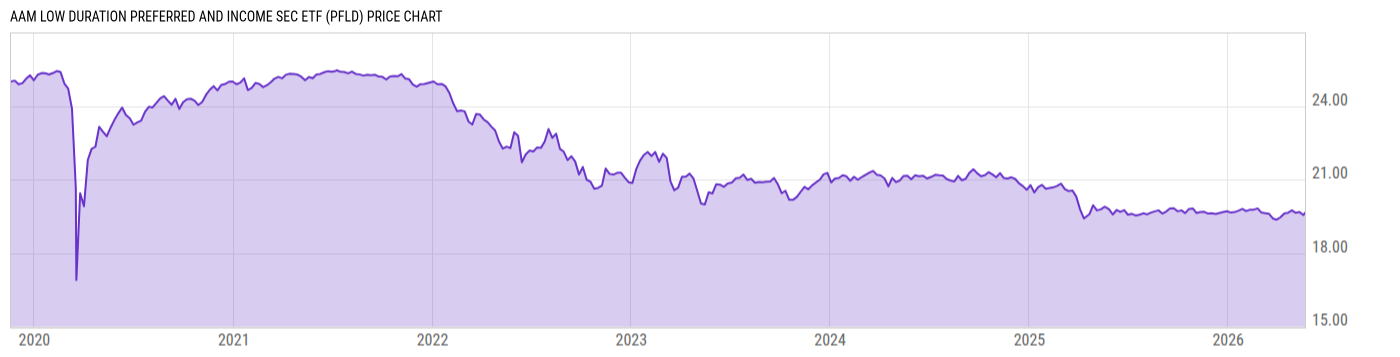
AAM Low Duration Preferred and Income Sec ETF (PFLD)
19.64
+0.03
(+0.15%)
USD |
NYSEARCA |
May 22, 16:00
Price Chart
Key Stats
| Net Expense Ratio | Discount or Premium to NAV | Total Assets Under Management | 30-Day Average Daily Volume |
|---|---|---|---|
| 0.45% | -0.02% | 426.28M | 70897.97 |
| Weighted Average Dividend Yield | Turnover Ratio (Generic) | 1 Year Fund Level Flows | Max Drawdown (Since Inception) |
| -- | 150.0% | -98.38M |
Basic Info
| Investment Strategy | |
| The Fund seeks to track the total return performance of the ICE 0-5 Year Duration Exchange-Listed Preferred & Hybrid Securities Index. The Index measures the performance of exchange-listed, US dollar-denominated preferred securities and hybrid securities with an option-adjusted duration of less than 5 years. |
| General | |
| Security Type | Exchange-Traded Fund |
| Equity Style | -- |
| Broad Asset Class | Taxable Bond |
| Broad Category | Fixed Income |
| Global Peer Group | Bond USD |
| Peer Group | Flexible Income Funds |
| Global Macro | Bond HC |
| US Macro | General Domestic Taxable Fixed Income Funds |
| YCharts Categorization | -- |
| YCharts Benchmark | -- |
| Prospectus Objective | Flexible Income Funds |
| Fund Owner Firm Name | Advisors Asset Management |
| Broad Asset Class Benchmark Index | |
| ^BBUSATR | 100.0% |
Performance Versus Peer Group
Annual Total Returns Versus Peers
As of May 24, 2026.
Asset Allocation
As of April 30, 2026.
| Type | % Net |
|---|---|
| Cash | 0.08% |
| Stock | 8.28% |
| Bond | 78.21% |
| Convertible | 0.00% |
| Preferred | 10.77% |
| Other | 2.66% |
Basic Info
| Investment Strategy | |
| The Fund seeks to track the total return performance of the ICE 0-5 Year Duration Exchange-Listed Preferred & Hybrid Securities Index. The Index measures the performance of exchange-listed, US dollar-denominated preferred securities and hybrid securities with an option-adjusted duration of less than 5 years. |
| General | |
| Security Type | Exchange-Traded Fund |
| Equity Style | -- |
| Broad Asset Class | Taxable Bond |
| Broad Category | Fixed Income |
| Global Peer Group | Bond USD |
| Peer Group | Flexible Income Funds |
| Global Macro | Bond HC |
| US Macro | General Domestic Taxable Fixed Income Funds |
| YCharts Categorization | -- |
| YCharts Benchmark | -- |
| Prospectus Objective | Flexible Income Funds |
| Fund Owner Firm Name | Advisors Asset Management |
| Broad Asset Class Benchmark Index | |
| ^BBUSATR | 100.0% |